StockFetcher Forums · Stock Picks and Trading · Generic<< 1 ... 46 47 48 49 50 ... 62 >>Post Follow-up
four
5,087 posts
msg #129678
- Remove message
modified
7/8/2016 12:12:26 PM

pt,
Remember the market has been moving up lately. The odd are in favor of bull filters.
Sometime it is luck and not smart that a filter looks good. Back test during a bear market and see if it keeps you out or reduces the number of hits. And to quote a few that have been on the board for a while... Money Management makes all the difference. Watch the poker players.

http://tradingsim.com/blog/jesse-livermore-money-management/
http://www.pokerlistings.com/money-management
http://www.tradeciety.com/money-management-turtle-traders/

Just a quick thought. The median bollinger band is the same as the MA.


en.wikipedia.org

Bollinger Bands consist of:

an N-period moving average (MA)
an upper band at K times an N-period standard deviation above the moving average (MA + Kσ)
a lower band at K times an N-period standard deviation below the moving average


LINE2: Looking to be outside the "norm"
LINE4: AND momentum attempting to go up

Fetcher[
open is below ma(20)
AND close 1 day ago is below lower bollinger band(20,2) 1 day ago
ma(20) < ma(20) 1 day ago
upper bollinger band(20,1) increasing the last 4 days
sort by column 3 descending
volume above 200000
day point range is above 0
price is between 1 and 15
draw bollinger band(20,2)
close crossed above lower bollinger band(20,2)
]


pthomas215
1,251 posts
msg #129679
- Remove message
7/8/2016 12:15:50 PM

once again four, much appreciated.

four
5,087 posts
msg #129690
- Remove message
modified
7/9/2016 12:34:27 AM


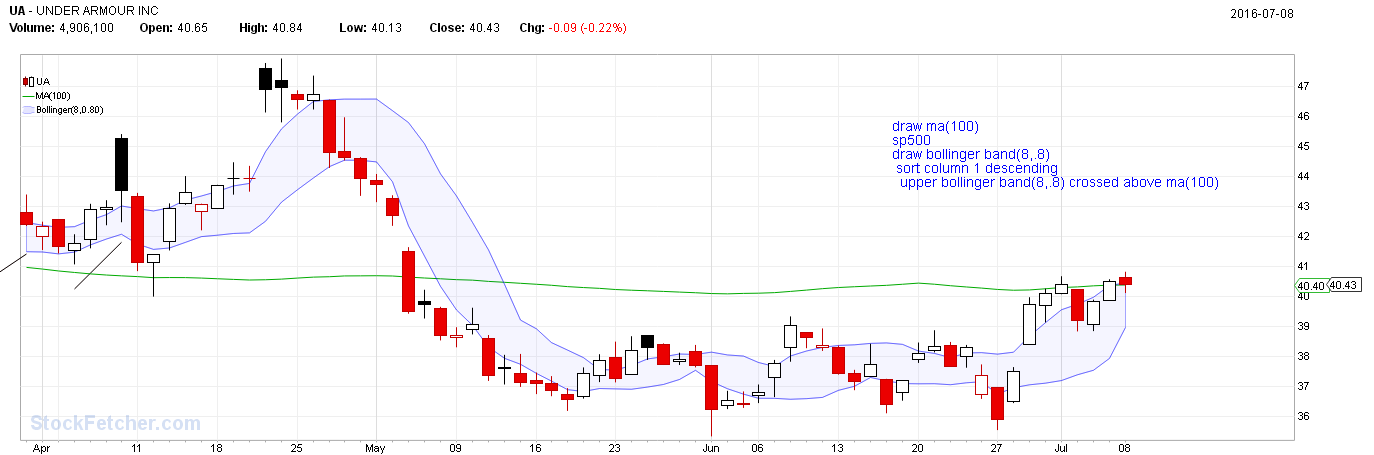
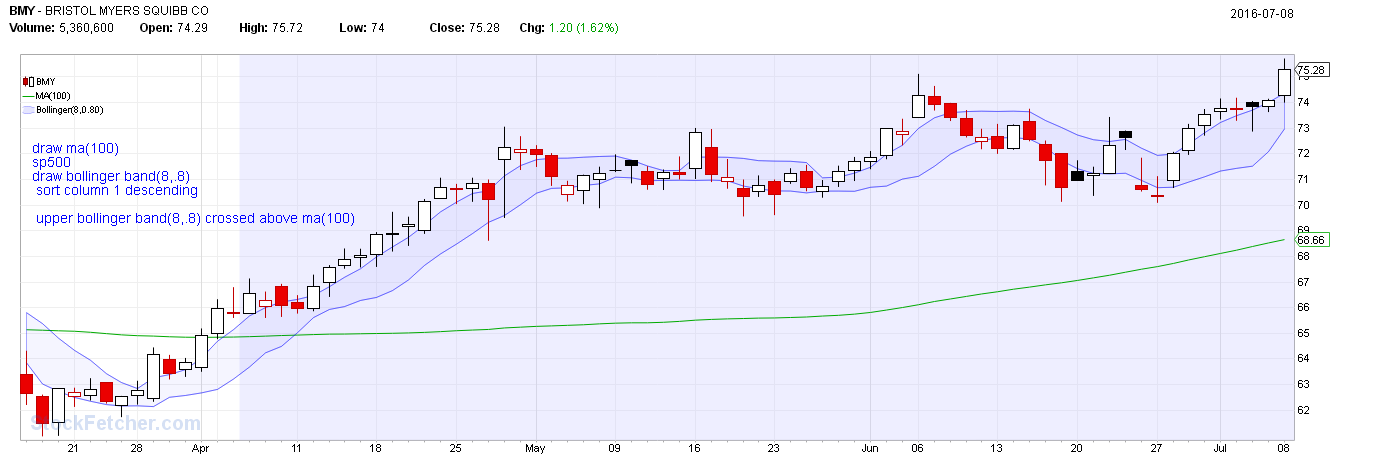
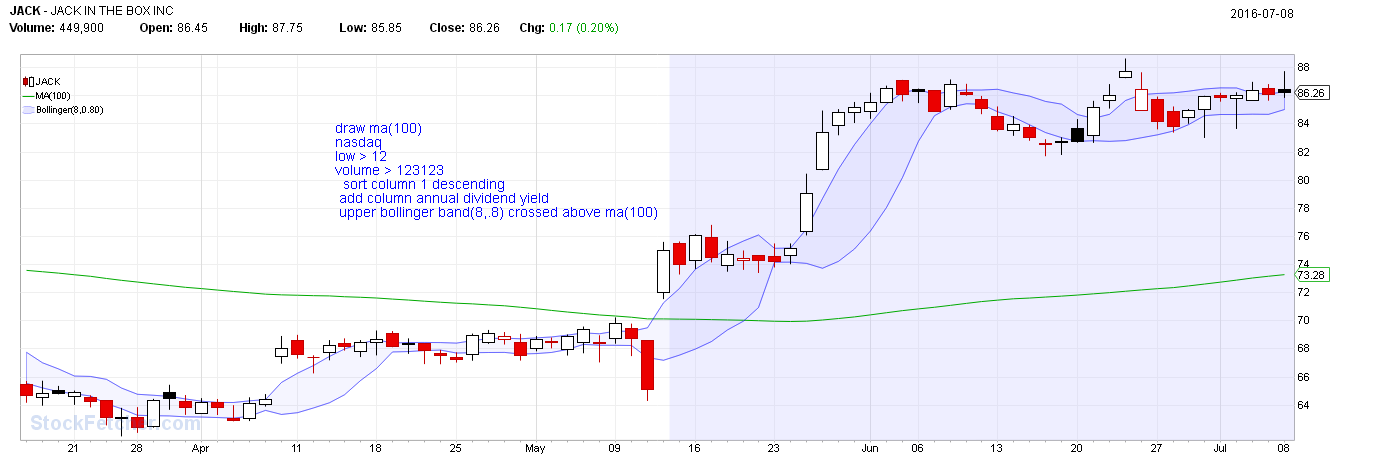
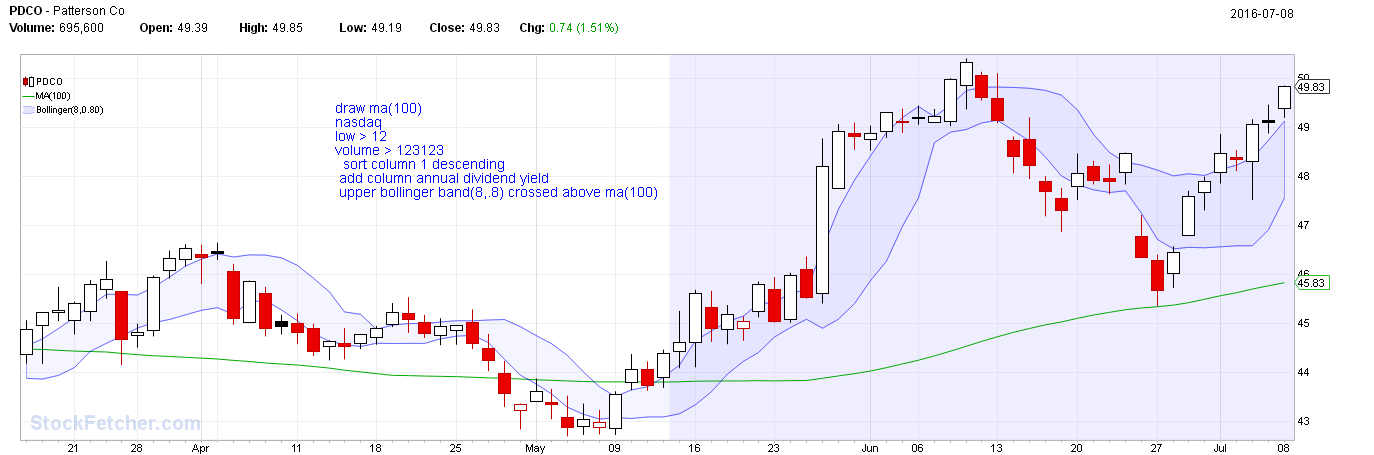
Fetcher[
draw ma(100)
nasdaq /*sp500*/
low > 12
volume > 123123
sort column 1 descending
add column annual dividend yield
upper bollinger band(8,.8) crossed above ma(100)
]


four
5,087 posts
msg #129704
- Remove message
modified
7/9/2016 10:40:58 PM


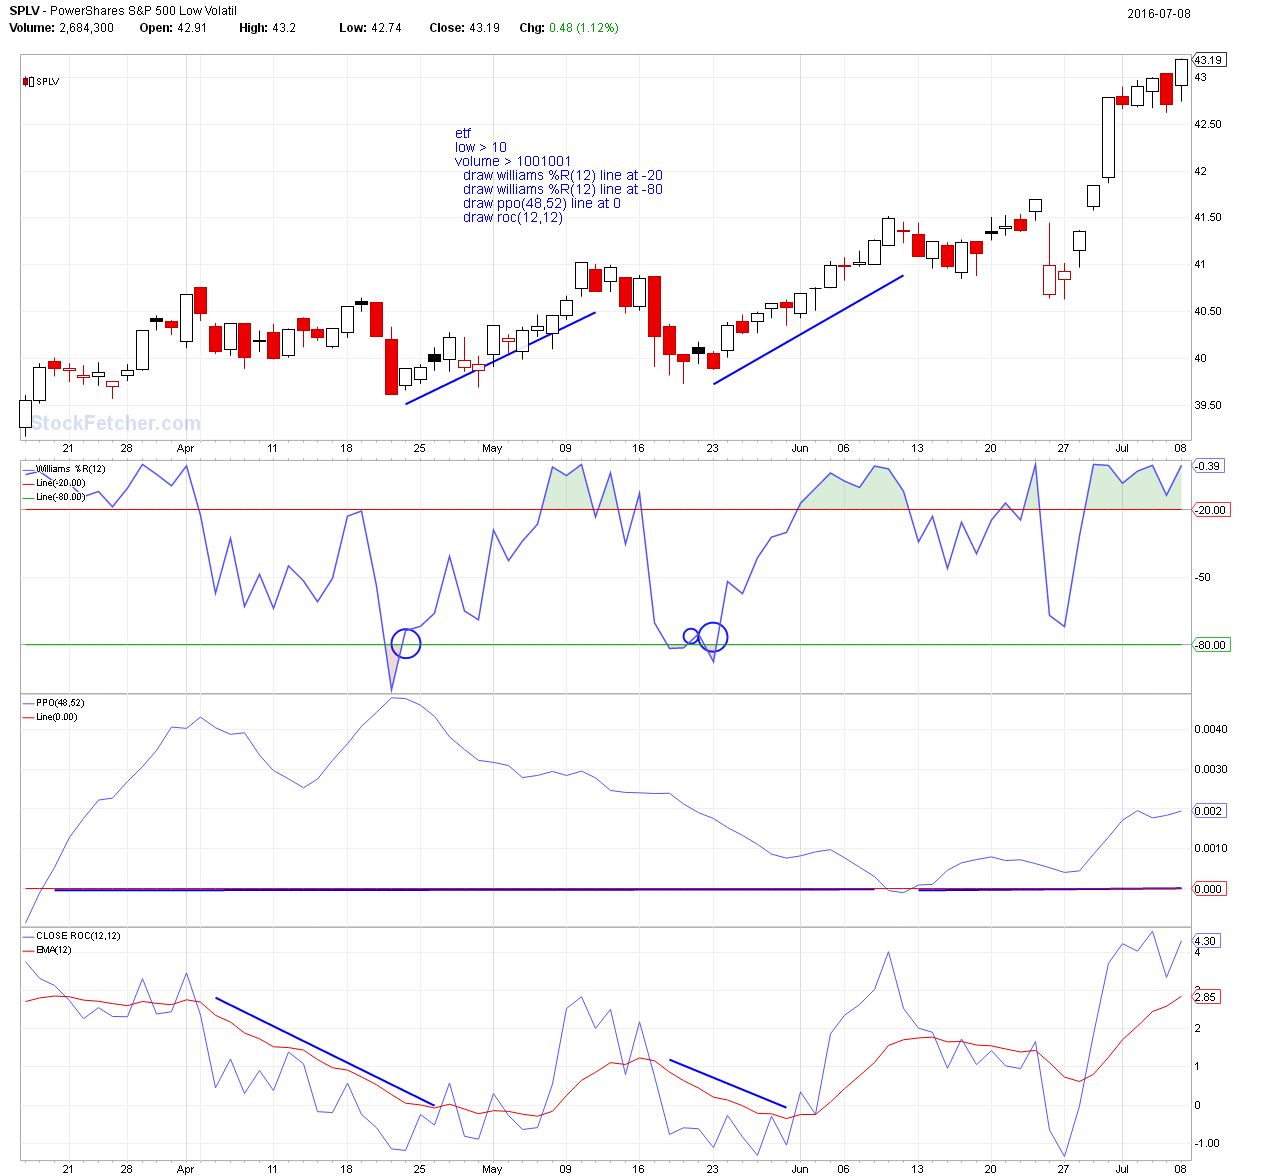
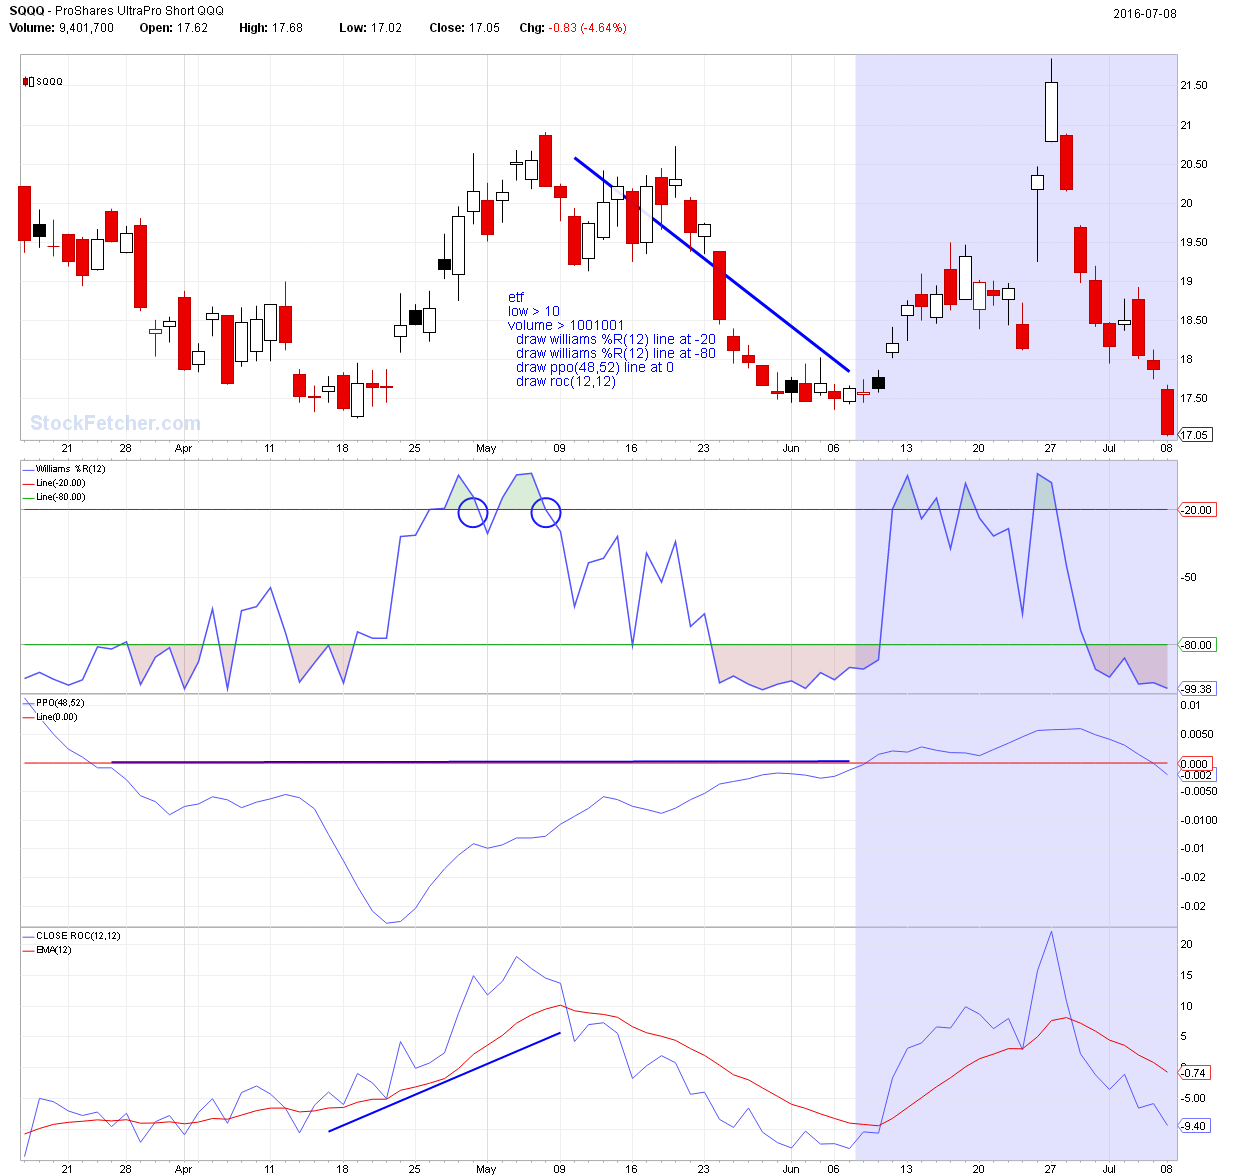
Fetcher[
etf
low > 10
volume > 1001001
draw williams %R(12) line at -20
draw williams %R(12) line at -80
draw ppo(48,52) line at 0
draw roc(12,12)
add column annual dividend yield
]


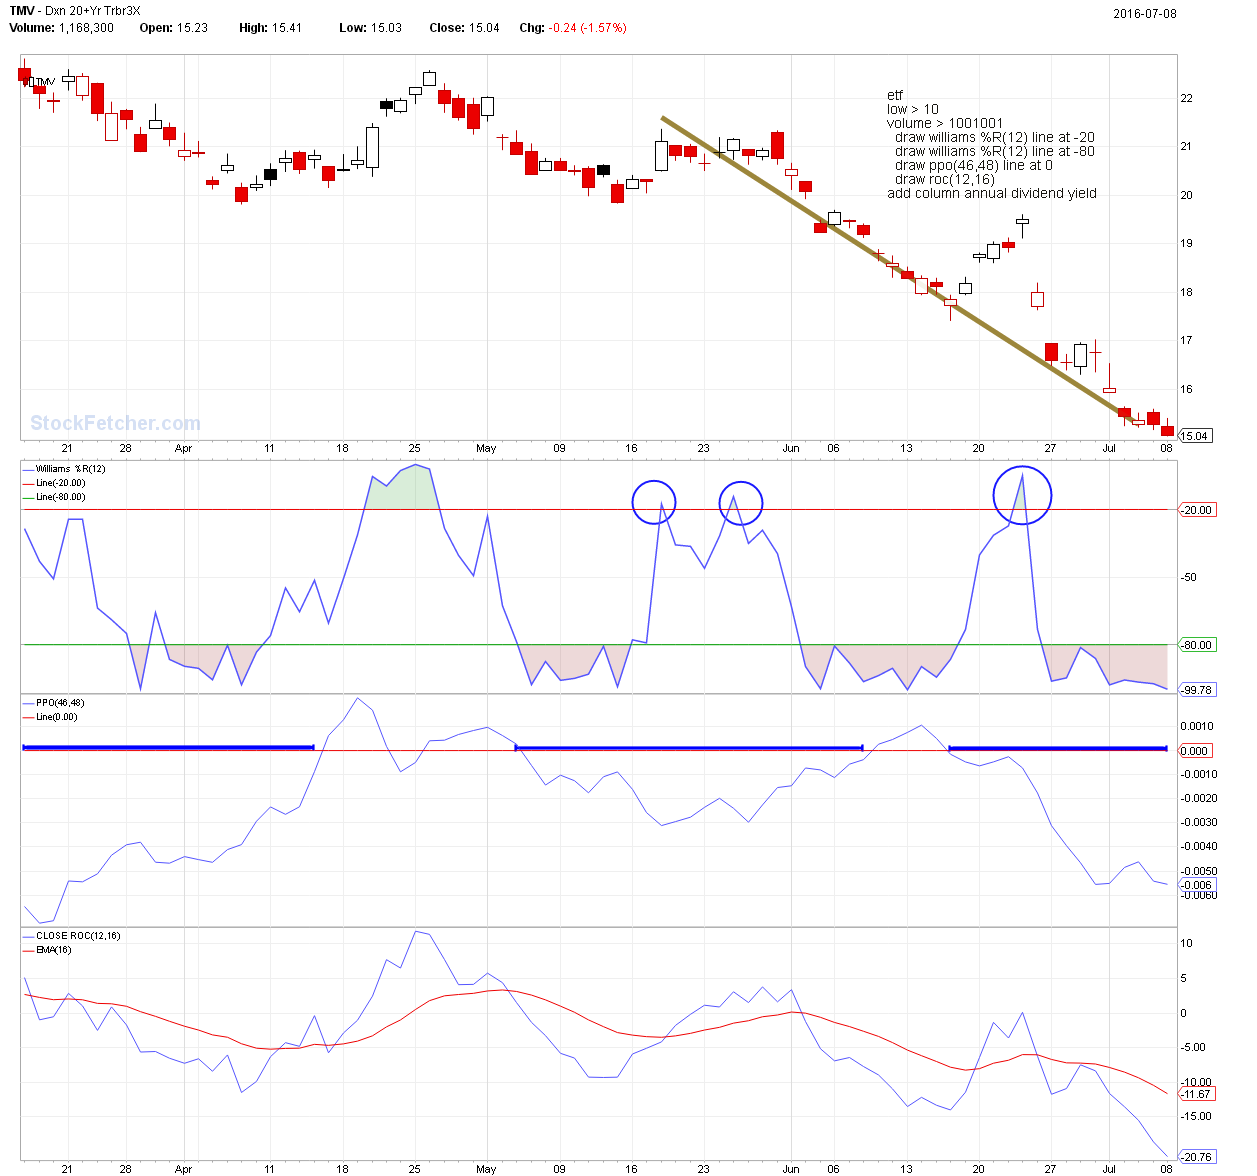
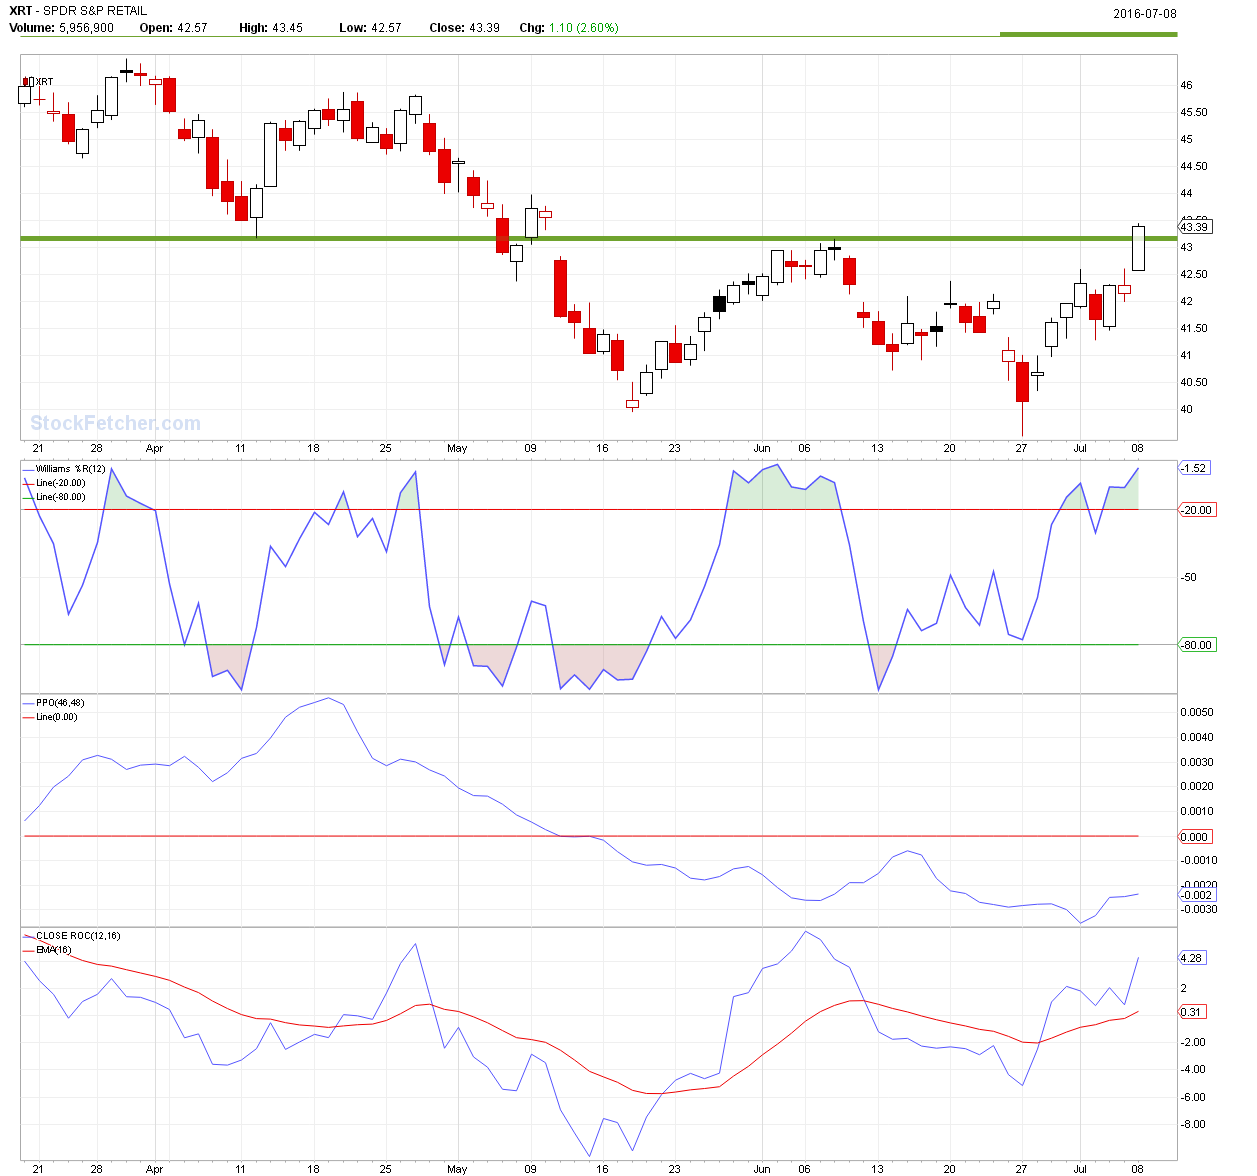
Fetcher[
etf
low > 10
volume > 1001001
draw williams %R(12) line at -20
draw williams %R(12) line at -80
draw ppo(46,48) line at 0
draw roc(12,16)
add column annual dividend yield
]


four
5,087 posts
msg #129707
- Remove message
7/9/2016 11:44:40 PM


four
5,087 posts
msg #129708
- Remove message
modified
7/10/2016 12:45:03 AM


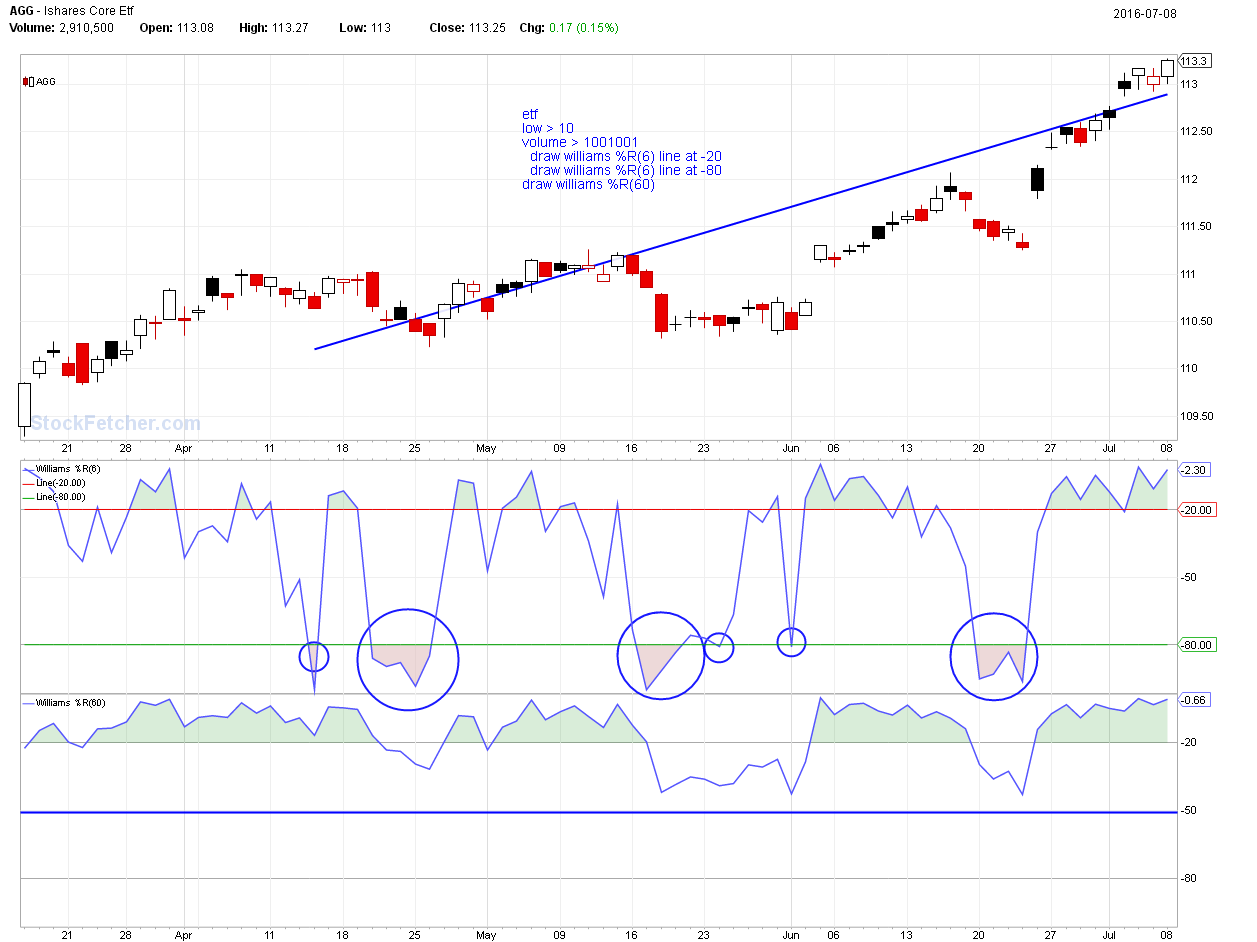
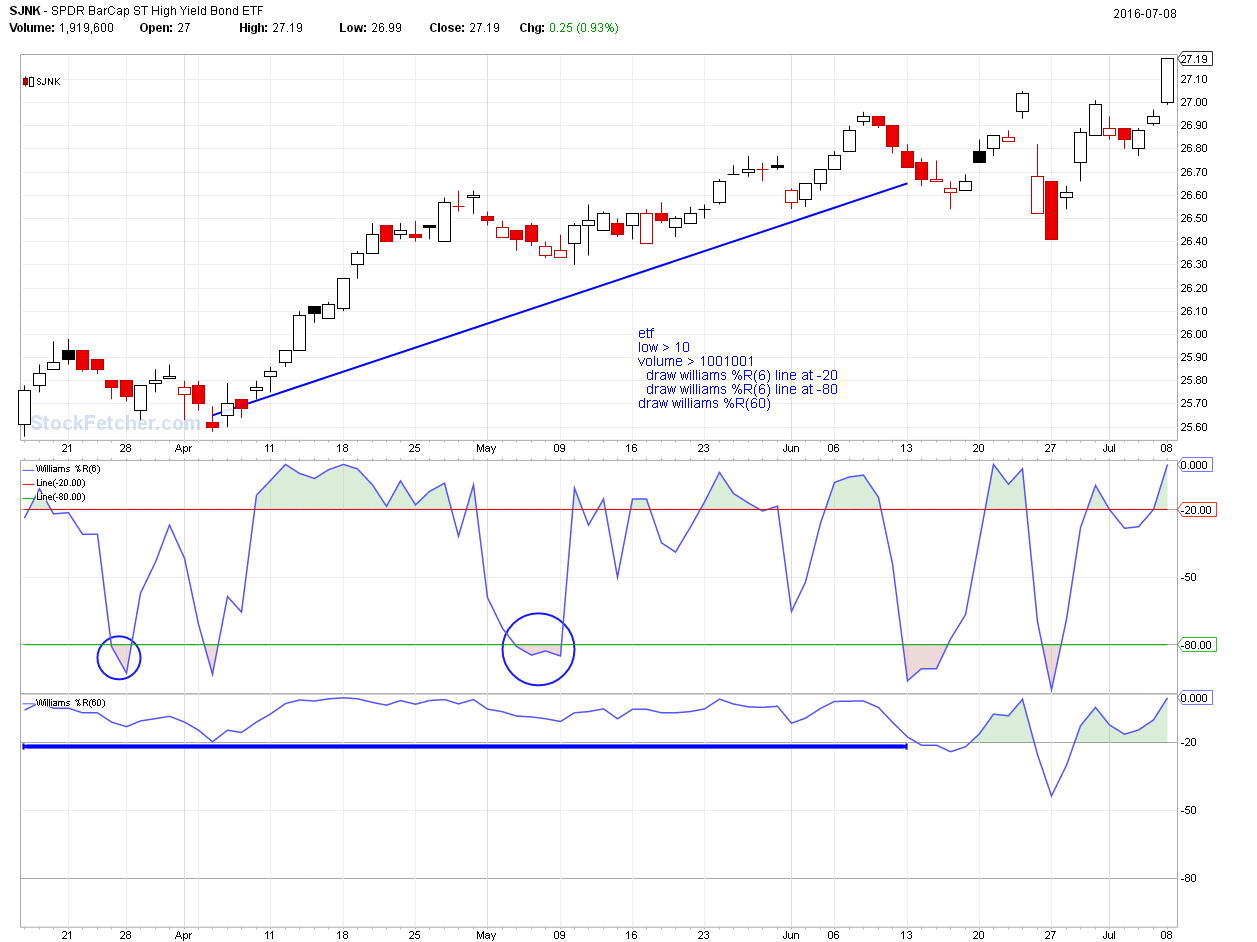
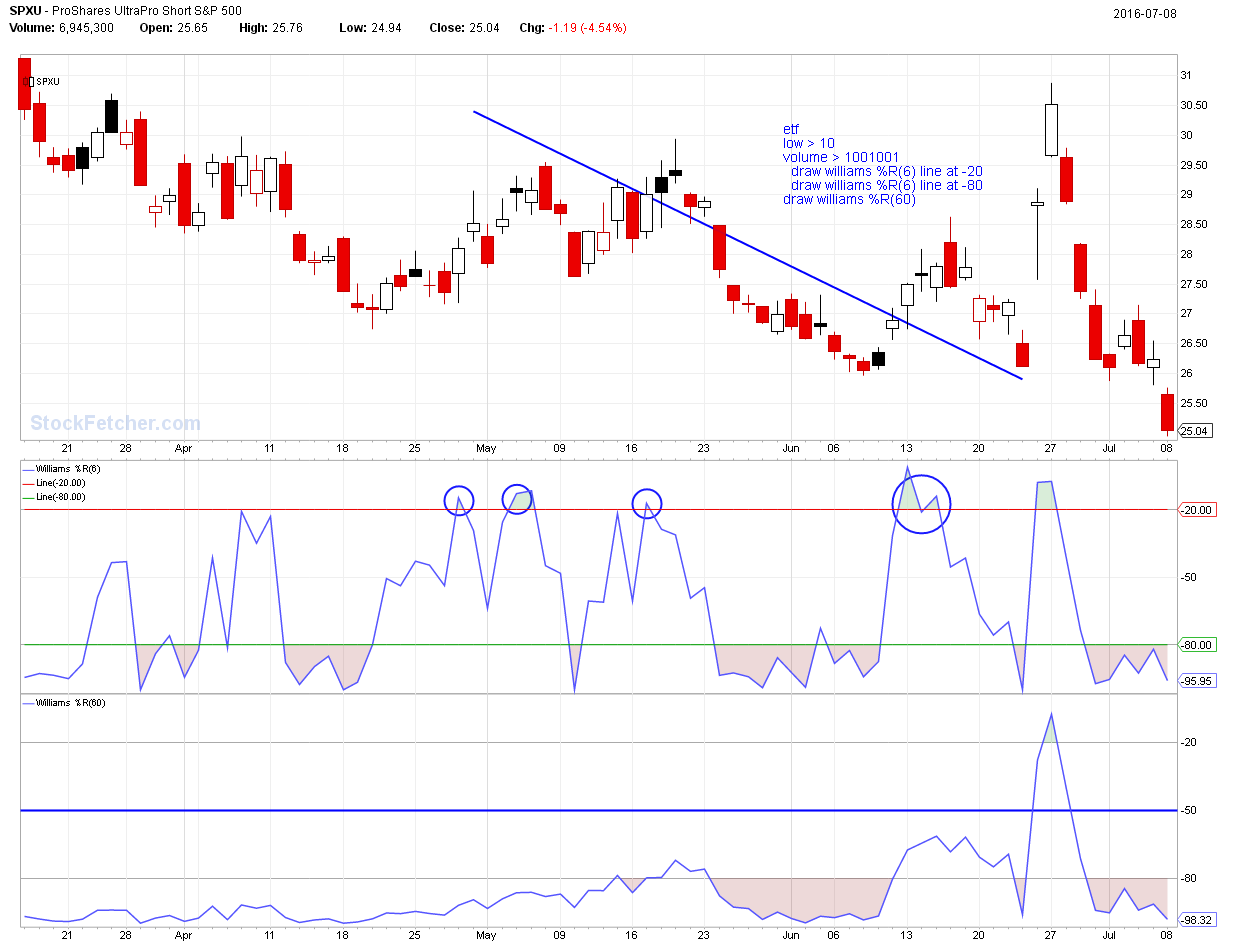
Fetcher[
etf
low > 10
volume > 1001001
draw williams %R(6) line at -20
draw williams %R(6) line at -80
draw williams %R(60)
]


shillllihs
6,102 posts
msg #129711
- Remove message
7/10/2016 12:39:44 PM


See how nearly every play goes over upper red line. Better with higher volume...

Fetcher[
open is below ma(20)
AND close 1 day ago is below lower bollinger band(20,2) 1 day ago
ma(20) < ma(20) 1 day ago
upper bollinger band(20,1) increasing the last 4 days
sort by column 3 descending
day point range is above 0
etf
draw bollinger band(20,2)
close crossed above lower bollinger band(20,2)
]


four
5,087 posts
msg #129715
- Remove message
7/10/2016 3:51:39 PM


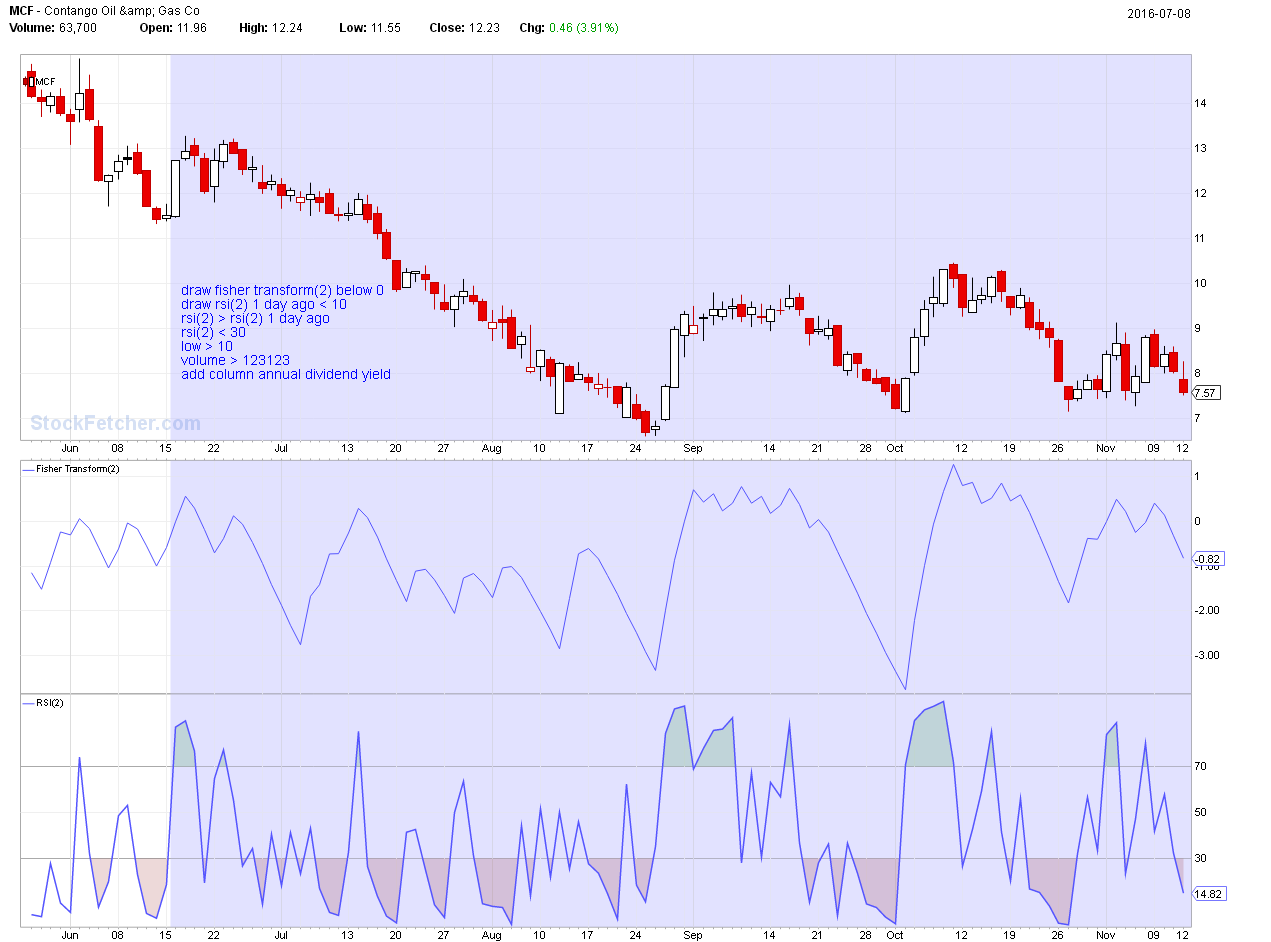
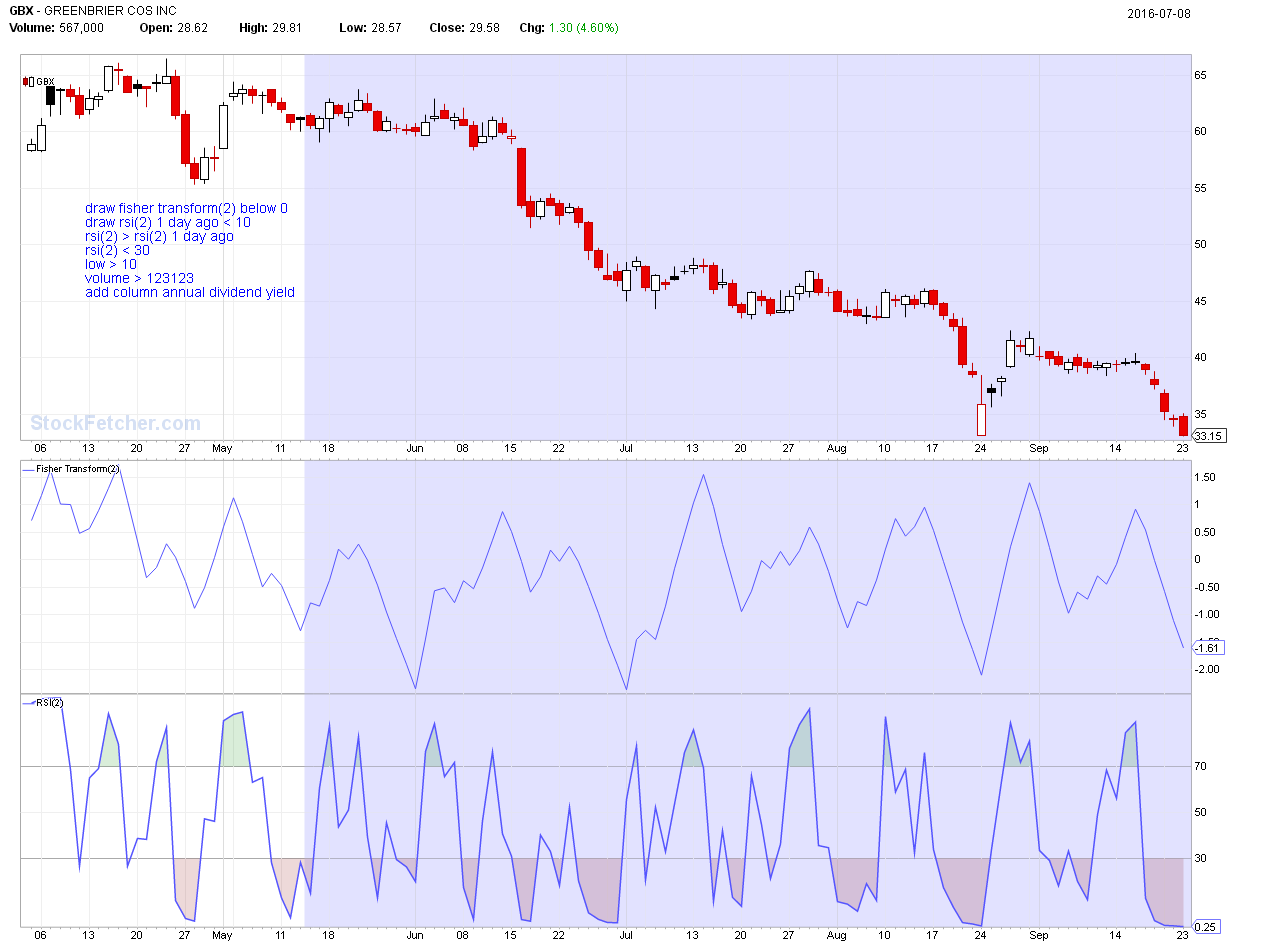
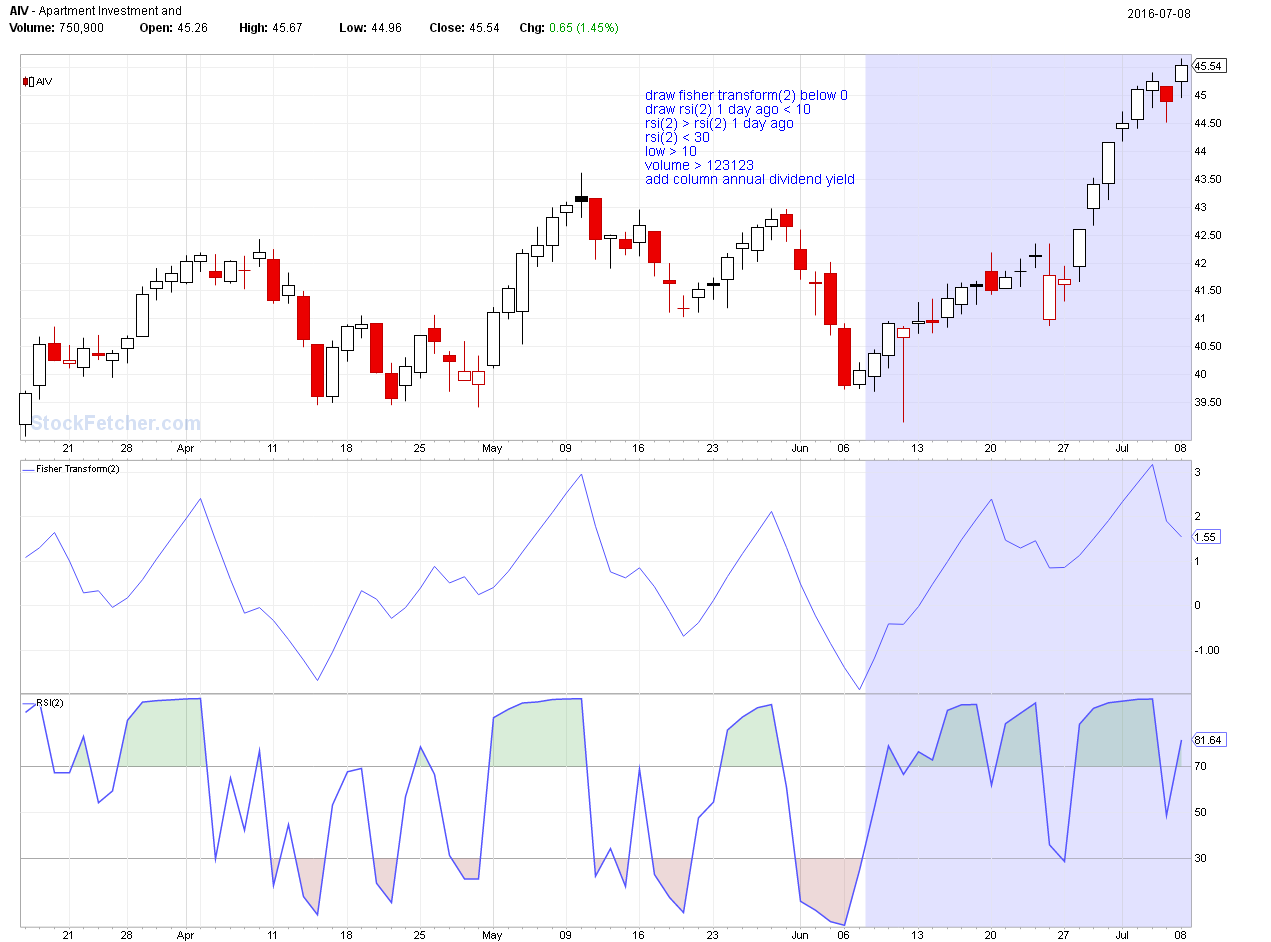
Fetcher[
draw fisher transform(2) below 0
draw rsi(2) 1 day ago < 10
rsi(2) > rsi(2) 1 day ago
rsi(2) < 30
low > 10
volume > 123123
add column annual dividend yield
]


shillllihs
6,102 posts
msg #129716
- Remove message
7/10/2016 4:34:45 PM

Fetcher[
draw fisher transform(2) below -.10
draw weekly rsi(2) 1 day ago < 10
weekly rsi(2) > rsi(2) 1 day ago
weekly rsi(2) < 29

volume > 123123
add column annual dividend yield
etf
]


four
5,087 posts
msg #129782
- Remove message
7/13/2016 9:32:38 AM


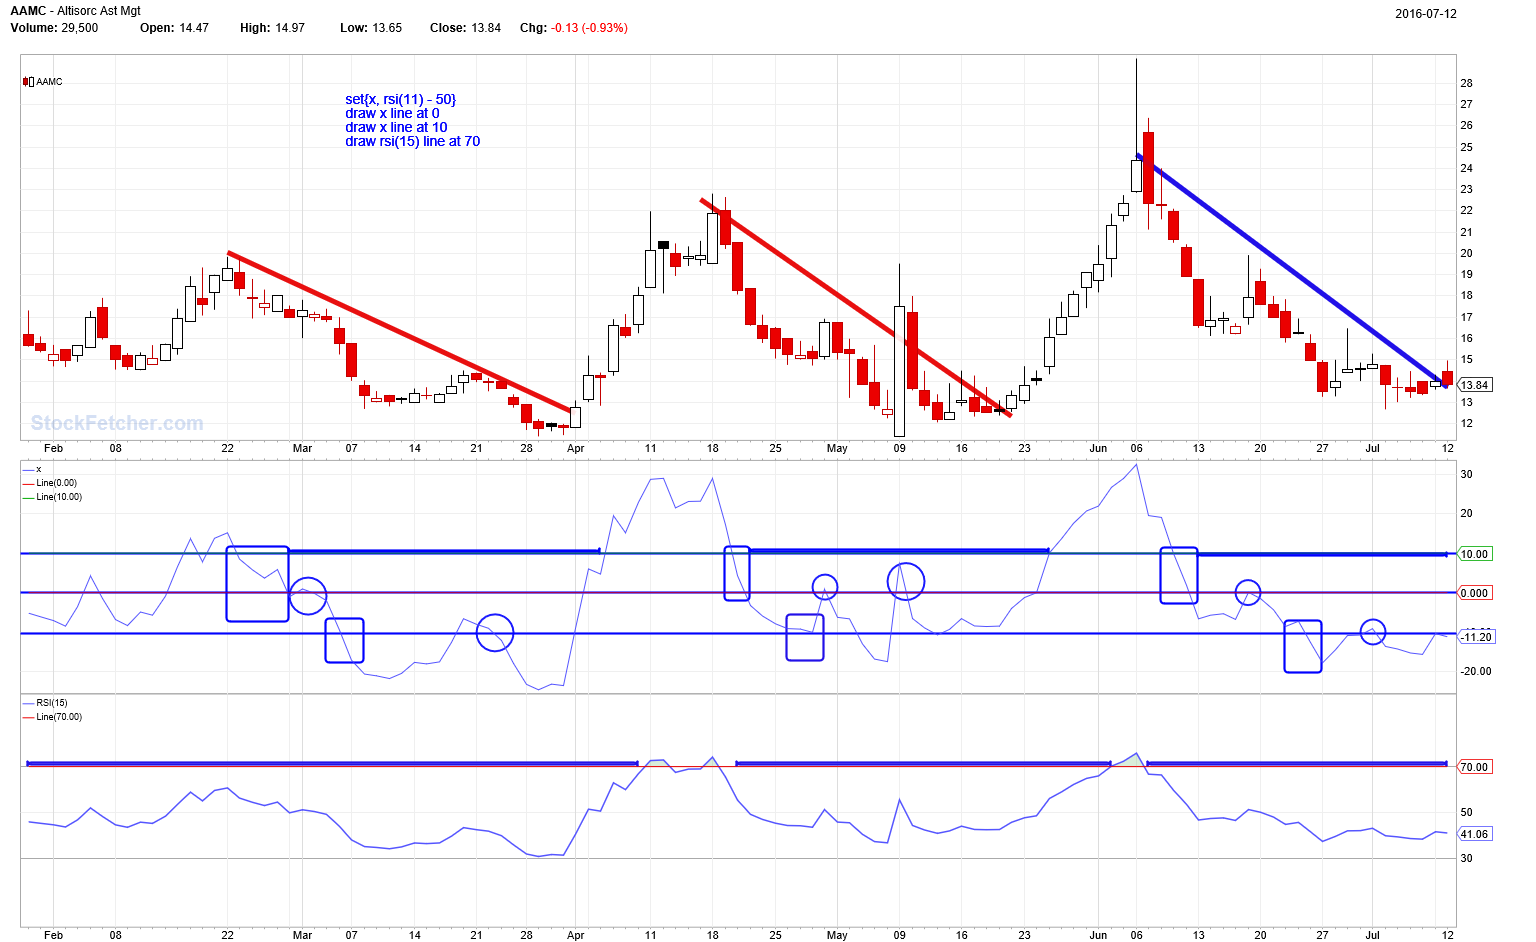
Fetcher[
set{x, rsi(11) - 50}
draw x line at 0
draw x line at 10
draw rsi(15) line at 70
add column annual dividend yield
low > 10
volume > 123123
]


StockFetcher Forums · Stock Picks and Trading · Generic<< 1 ... 46 47 48 49 50 ... 62 >>Post Follow-up

*** Disclaimer *** StockFetcher.com does not endorse or suggest any of the securities which are returned in any of the searches or filters. They are provided purely for informational and research purposes. StockFetcher.com does not recommend particular securities. StockFetcher.com, Vestyl Software, L.L.C. and involved content providers shall not be liable for any errors or delays in the content, or for any actions taken based on the content.


Copyright 2026 - Vestyl Software L.L.C.•Terms of Service | License | Questions or comments? Contact Us
EOD Data sources: DDFPlus & CSI Data Quotes delayed during active market hours. Delay times are at least 15 mins for NASDAQ, 20 mins for NYSE and Amex. Delayed intraday data provided by DDFPlus


This site is protected by reCAPTCHA and the Google Privacy Policy and Terms of Service apply.