| StockFetcher Forums · Stock Picks and Trading · Generic | << 1 ... 43 44 45 46 47 ... 62 >>Post Follow-up |
| four 5,087 posts msg #129547 - Remove message |
7/1/2016 11:53:57 PM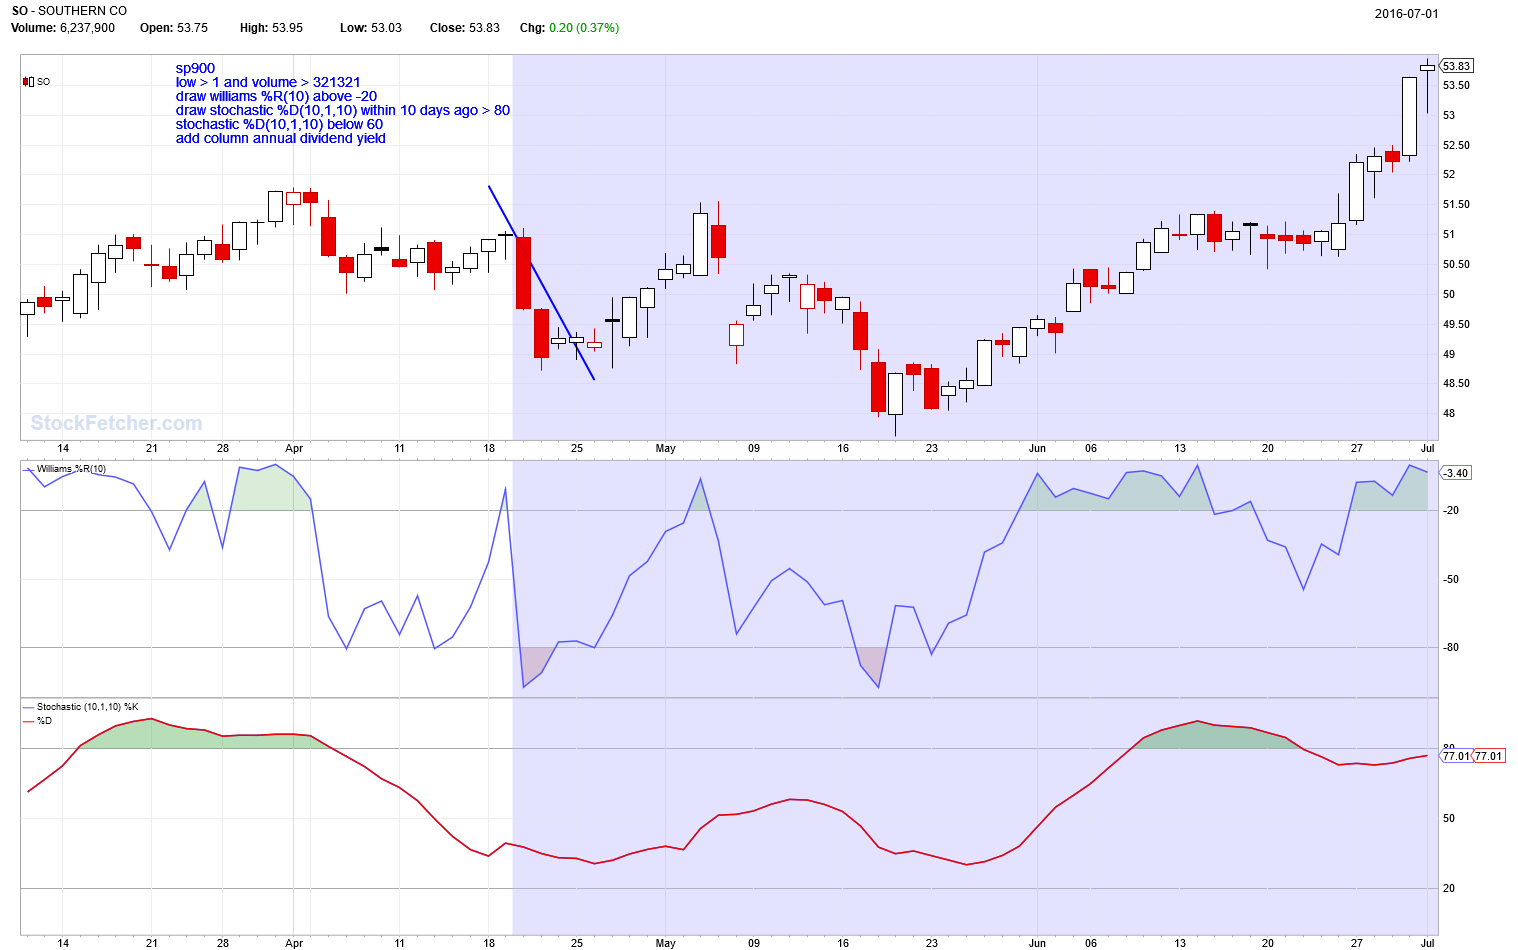 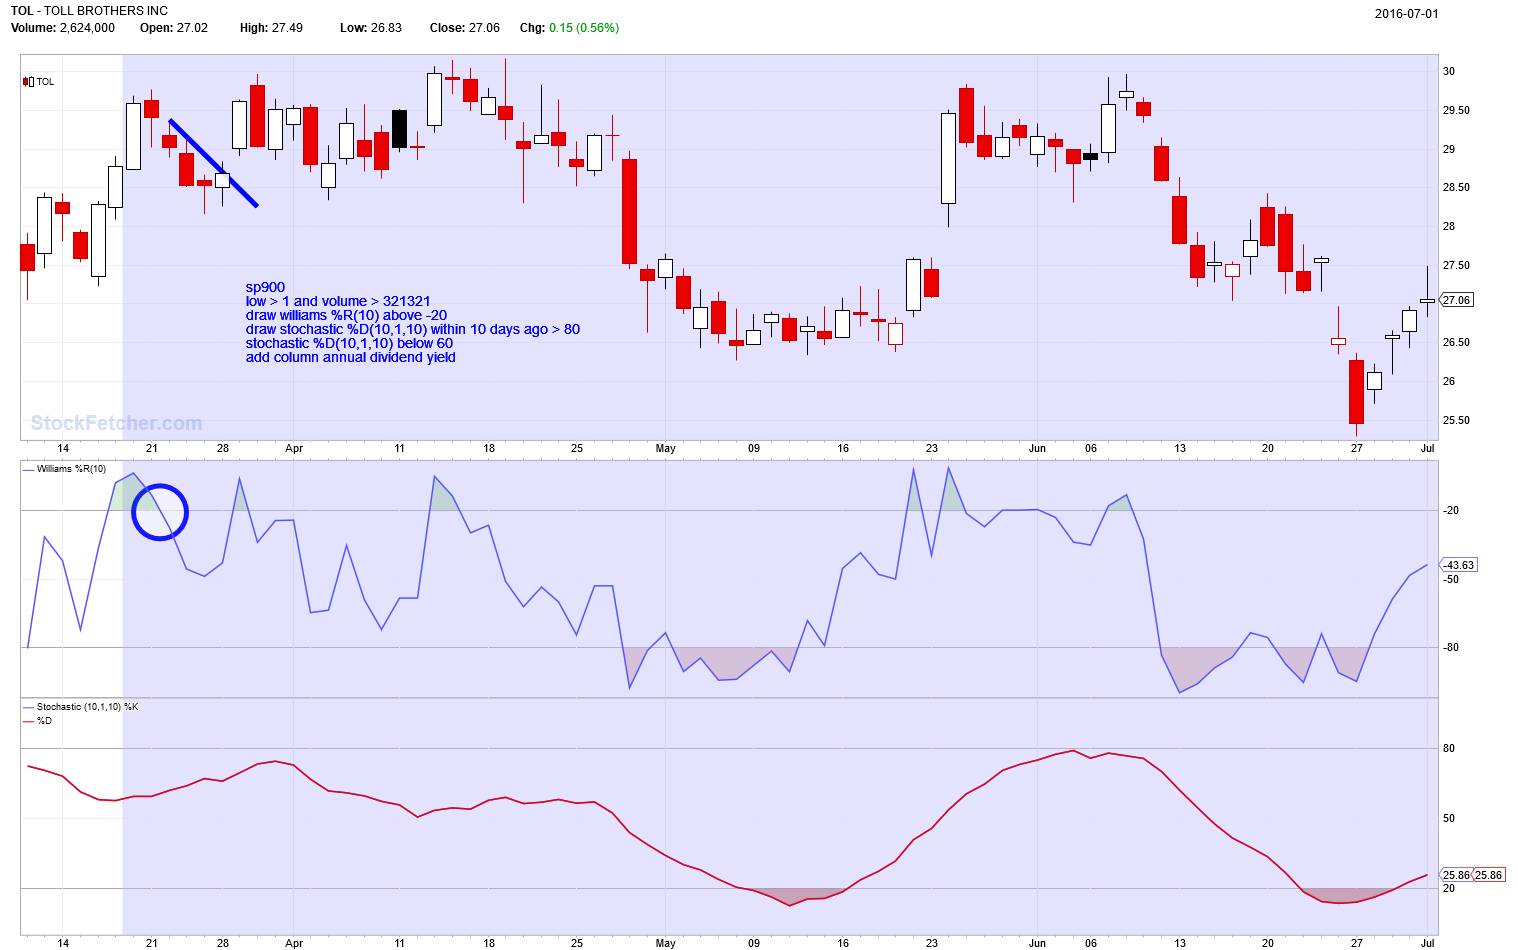 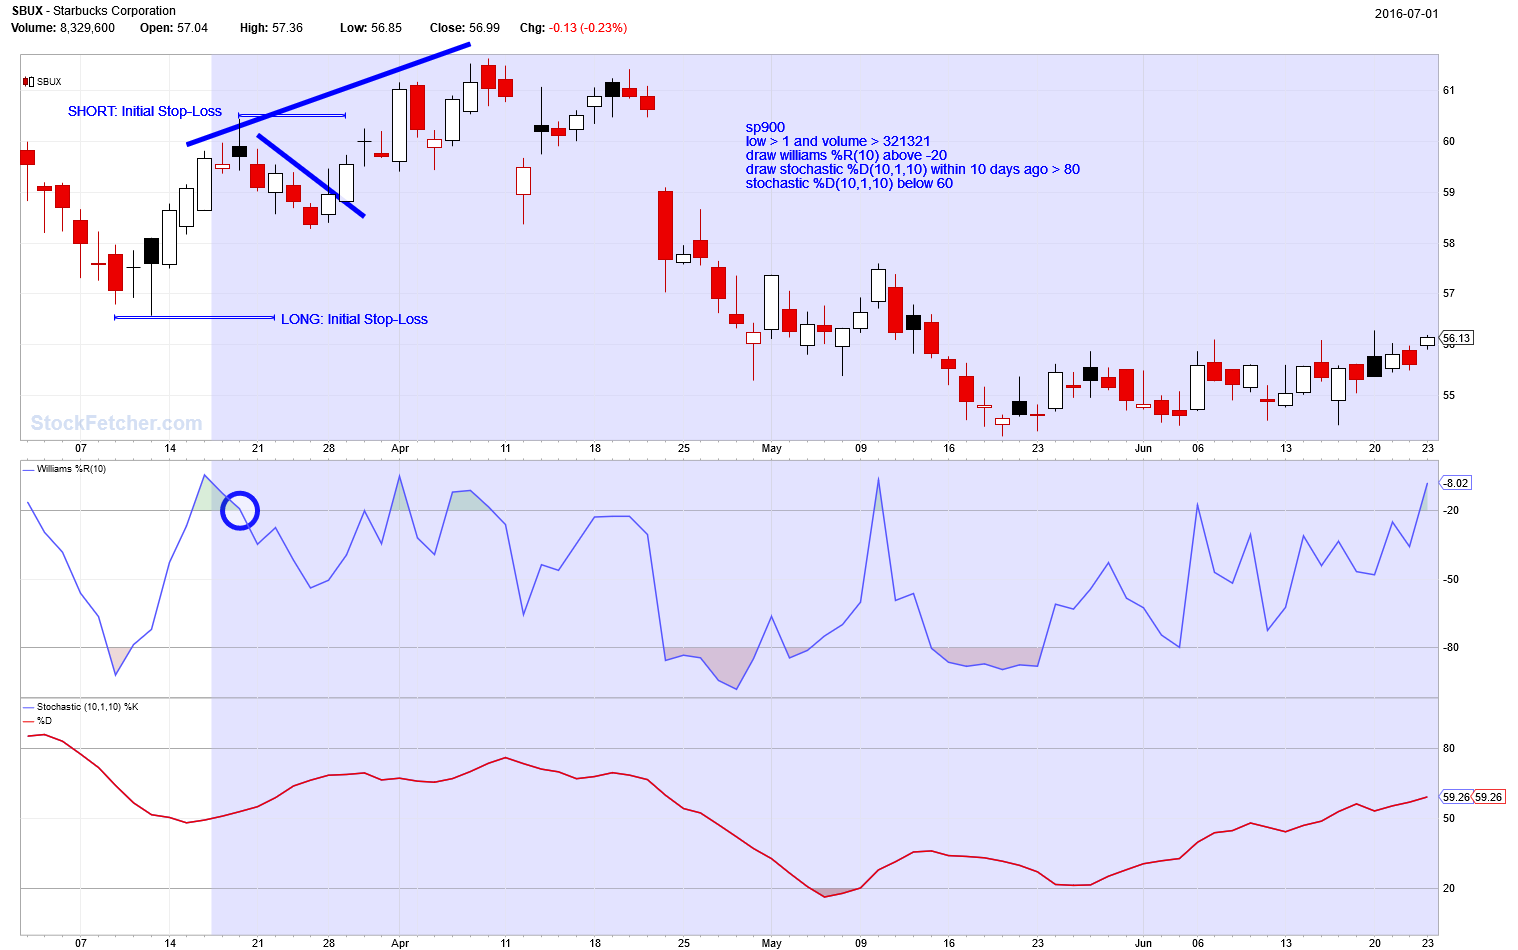 |
| four 5,087 posts msg #129548 - Remove message modified |
7/1/2016 11:58:16 PM ahcsim72, 1. Some posts about cloud http://www.stockfetcher.com/sf/search.php?q=ichimoku&filter=&sort= 2. 95% of my filters are here -- Generic -- and the other 5% are "sprinkled" throughout the forums. 3. FYI: http://www.ichimokutrader.com/ 4. I have never traded with the cloud Covel Trend Following Dice Roll https://vimeo.com/50548951#at=51 - http://www.trendfollowing.com/resources/ - http://www.trendfollowing.com/podcasts/ - http://www.trendfollowing.com/product/trend-following-investment-research-flagship-package/ |
| pthomas215 1,251 posts msg #129549 - Remove message |
7/2/2016 1:29:49 AM FOUR: What is your favorite bollinger band filter that you see the most success with? I've toyed around with a few but cant seem to find one that signals before the bump. |
| four 5,087 posts msg #129553 - Remove message modified |
7/2/2016 2:19:02 PM Investigate (...I don't have a favorite) http://bollingerbandgenius.com/bollinger-bands/short-term-buying-signals/ Work with this and see what works for you...? 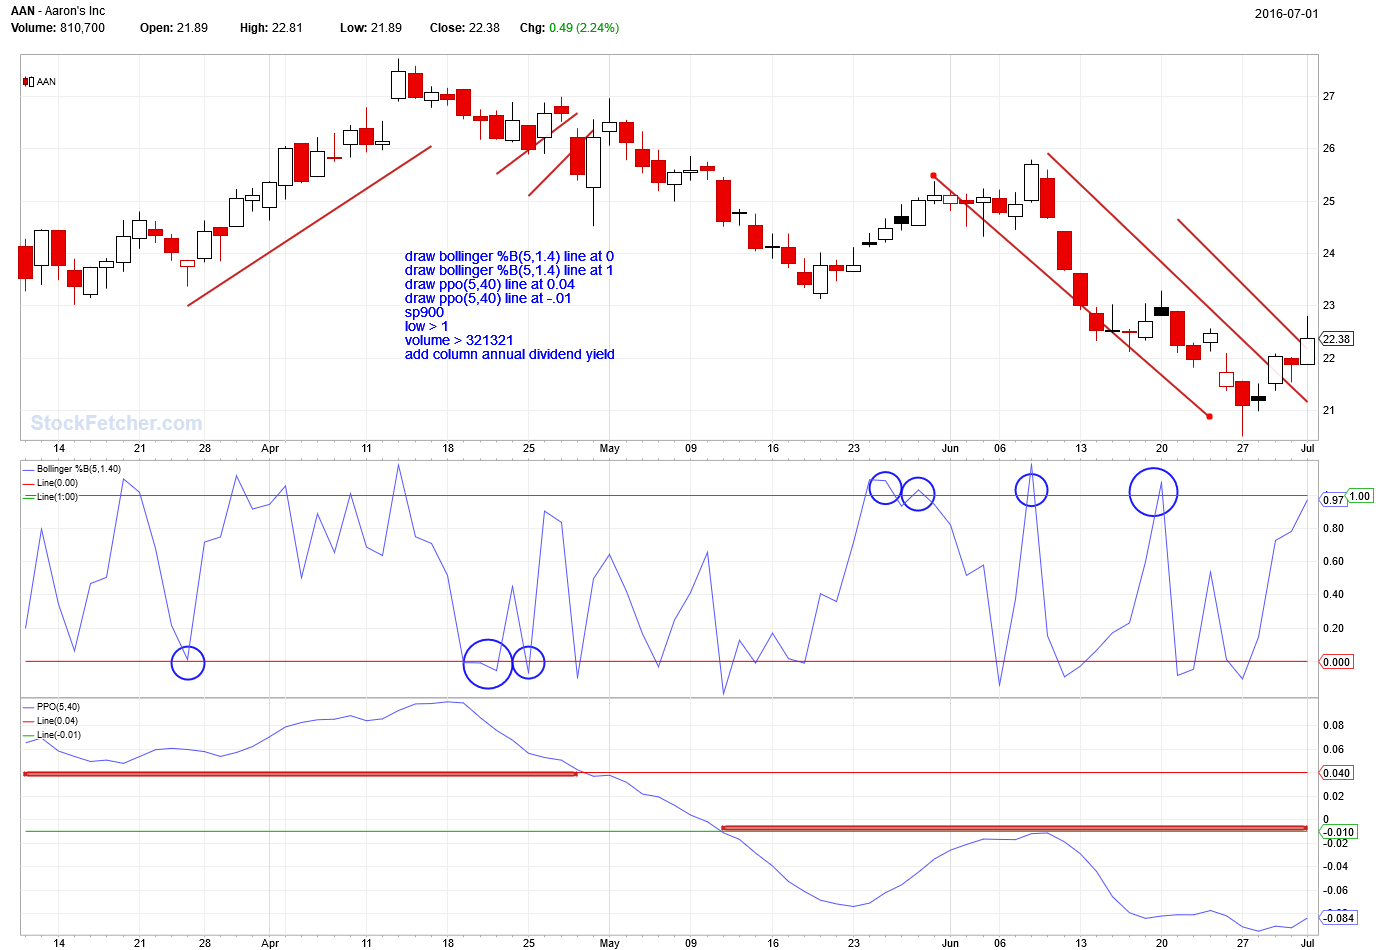 |
| pthomas215 1,251 posts msg #129556 - Remove message |
7/2/2016 6:29:55 PM Thank you. I've been going through all of them here for the past month and find it so interesting. this stuff can be overwhelming sometimes. so much data. appreciate it. |
| four 5,087 posts msg #129557 - Remove message modified |
7/2/2016 6:54:13 PM Have you noticed... a theme to the filters (a favorite theme/pattern but no favorite filter...) usually two indicators (1. more days 2. fewer days) usually a high is met and then a need to stay above a threshold and the fewer days is going to make a low for the trade : Opposite for short ( a low is met and a need to stay below a threshold and the fewer days is going to make a high for the trade) See below 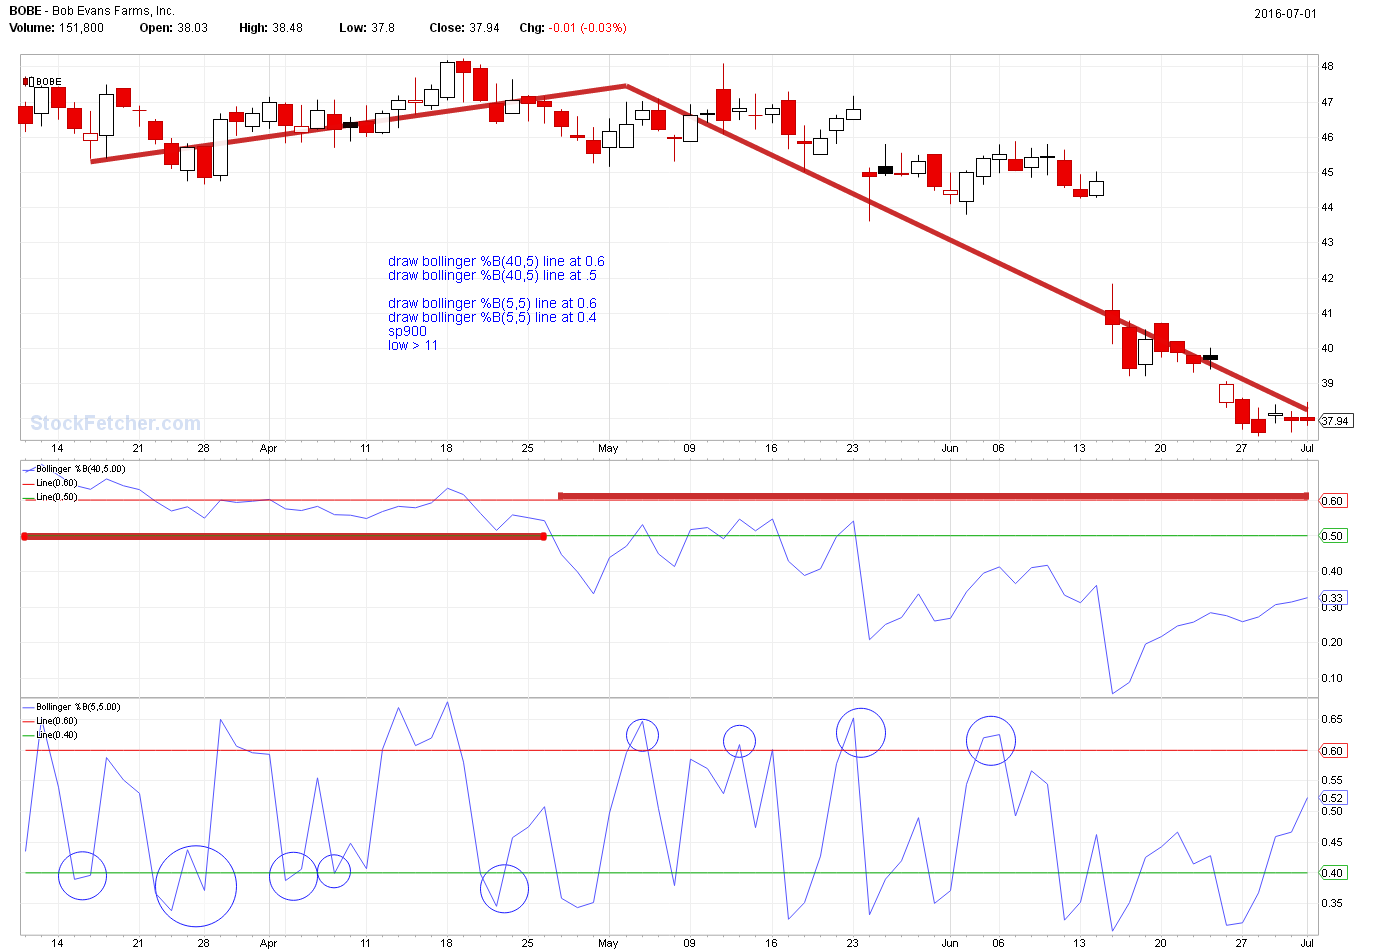 |
| four 5,087 posts msg #129558 - Remove message modified |
7/2/2016 10:33:13 PM http://www.forbes.com/sites/toddganos/2011/12/15/wise-up-normal-market-behavior-is-not-normal-but-crazy-is/#41b80049597f -------------------------------------------------------- - Hindsight - 144 results from Monday June 27, 2016 - Close Results Delay times are at least 15 mins for NASDAQ, 20 mins for NYSE and Amex. -- Mon 27th to Fri 1st 141 winners Vs 3 losers winners: 2% - 12% losers: -3% to -.25% -- |
| pthomas215 1,251 posts msg #129559 - Remove message |
7/2/2016 11:41:58 PM I never thought about it like that. I think I follow you, just by looking at the chart. I have always just looked at rsi and williams but this helps. does this accomplish the same concept? |
| four 5,087 posts msg #129560 - Remove message modified |
7/3/2016 12:29:49 AM Let's start from scratch. Start by understanding my post. View the below information and image and then answer the questions. There are two Bollinger %B: bollinger %B(40,5) bollinger %B(5,5)  |
| pthomas215 1,251 posts msg #129561 - Remove message |
7/3/2016 12:59:12 AM ok. 1. b40, 5 is longer 2. b5,5 is shorter 1.longer indicator must break above . 5 2. longer indicator must stay above.6 for short longer indicator must hit and remain below .5 I think I understand most of it conceptually. so a stock is in a certain range for most of the time and Im trying to catch it when it goes outside the range. i suppose the june 27th data threw me off |
| StockFetcher Forums · Stock Picks and Trading · Generic | << 1 ... 43 44 45 46 47 ... 62 >>Post Follow-up |