| StockFetcher Forums · Stock Picks and Trading · Intraday Alerts | << 1 ... 1511 1512 1513 1514 1515 ... 1903 >>Post Follow-up |
| four 5,087 posts msg #129229 - Remove message |
6/17/2016 9:07:58 PM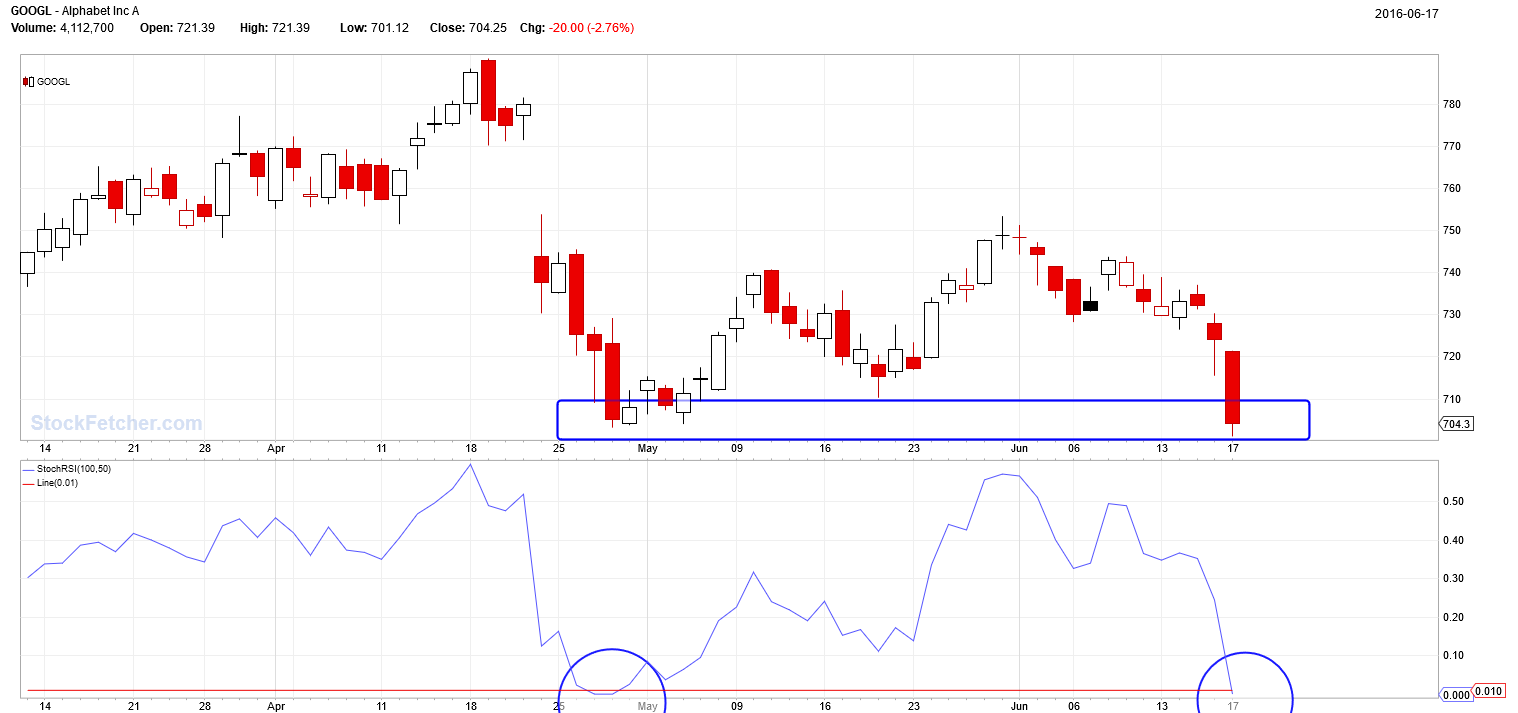 |
| karennma 8,057 posts msg #129252 - Remove message |
6/20/2016 12:29:01 PM karennma 6,230 posts msg #129214 6/17/2016 10:04:35 AM Too late L - ALXN- $125.87 I really should stay away from the pharmas. Never works out for me. =========== So, ALXN gaps UP to $128.68! Wonderful! But, I'm still IN it. Not so wonderful. |
| karennma 8,057 posts msg #129253 - Remove message |
6/20/2016 12:30:34 PM karennma 6,224 posts msg #129215 - Edit message 6/17/2016 10:09:24 AM L GUSH 75.57 ================ $76.75 Up a dollah Will try for $2. (greed) ************************ GUSH gaps up to $82.89! Wonderful! But, I'm still in it. Not so wonderful. :>( |
| karennma 8,057 posts msg #129254 - Remove message |
6/20/2016 12:43:51 PM being stupid makes me tired. |
| karennma 8,057 posts msg #129255 - Remove message |
6/20/2016 3:12:57 PM ALXN $125.00 now. JInxed myself! I can' t post my picks here. It's bad luck. |
| johnpaulca 12,036 posts msg #129257 - Remove message |
6/20/2016 4:12:36 PM Luck has nothing to do with it. SPY... hit resistance within the first 40-mins(BB125 or 209.45) then nose dived from there....see 2-hr chart. Believe or not it was a fairly easy trading day for day traders. You need to know the turning points, draw on your charts before market opens. I've said many times BB125 is a tough band to break. |
| karennma 8,057 posts msg #129258 - Remove message |
6/20/2016 5:34:09 PM And, in the past,I've asked you to post a "BB125". I don't know what it looks like. |
| johnpaulca 12,036 posts msg #129259 - Remove message |
6/20/2016 5:52:47 PM Sorry Karen I've explained it in the past. I use the following bands It doesn't look like much and probably not much but I've learned price behavior around them. Bollinger bands(40,0.4) Bollinger Band (125,0.1) uptrend: BB40 should be above BB125, reverse for downtrend. Let me know if you have any questions...gotta fly. |
| four 5,087 posts msg #129261 - Remove message |
6/20/2016 8:03:16 PM JP, please comment on these two charts (long/short/stop-loss...) 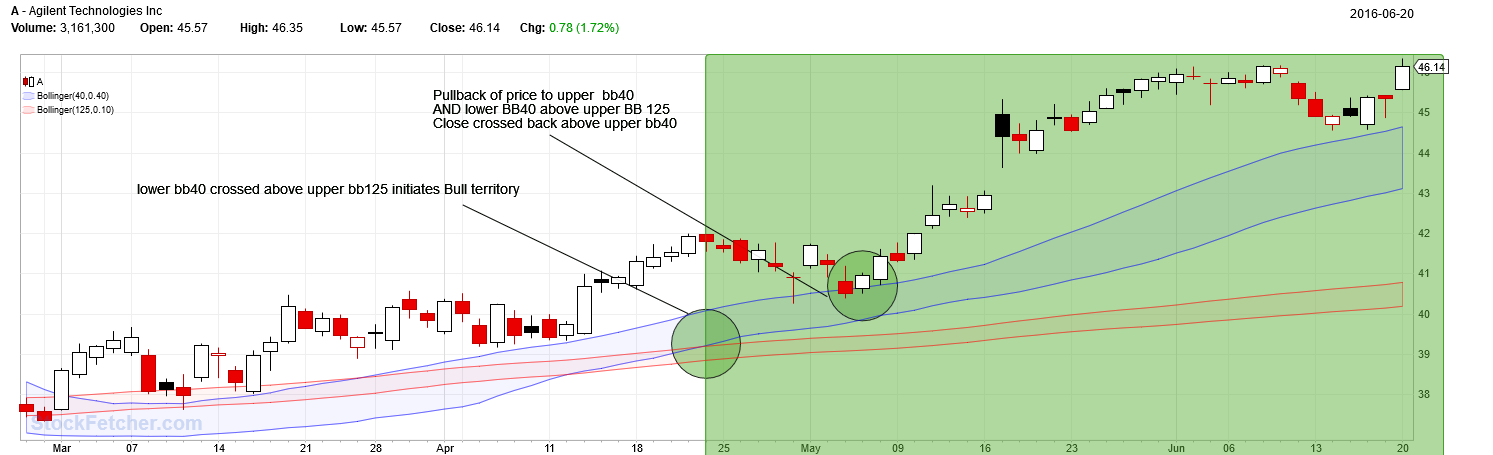 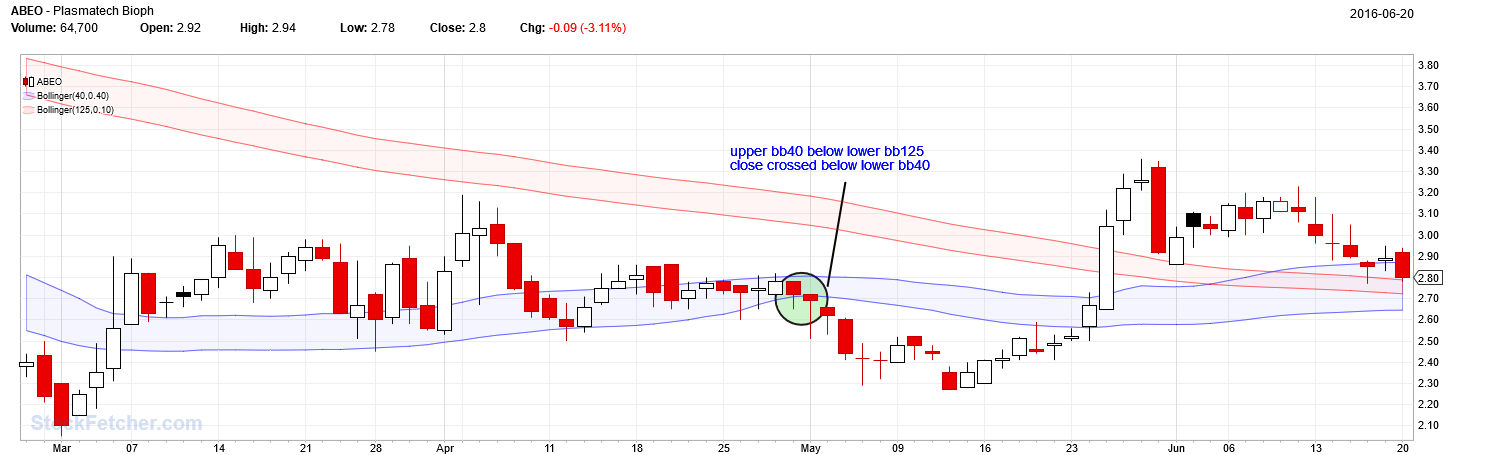 |
| pthomas215 1,251 posts msg #129262 - Remove message |
6/20/2016 8:10:22 PM karen, I took a stab at it because I was curious too. this one you would go long on, not short. |
| StockFetcher Forums · Stock Picks and Trading · Intraday Alerts | << 1 ... 1511 1512 1513 1514 1515 ... 1903 >>Post Follow-up |