| StockFetcher Forums · Stock Picks and Trading · Generic2 | << 1 ... 6 7 8 9 10 ... 13 >>Post Follow-up |
| tugga82 12 posts msg #133057 - Remove message |
12/5/2016 12:41:00 PM Four, Am relatively new to trading and you seem to be a wealth of knowledge when it comes to trading and coming up with a variety of filters. I also came across this below code from your read only post earlier and was wondering if you can walk me through the logic and how to trade the set up from below. Anything you can do to help will be appreciated. Cheers, Tugga /* Extreme Finder 1.0 */ sp900 low > 1 and volume > 123123 and close < lower Bollinger band(40,0.4) and draw ppo(1,20) < -.10 and ppo(1,5) > ppo(1,5) 1 day ago draw ppo(1,5) 1 day ago < -.05 draw ppo(1,5) line at -.05 draw ppo(1,20) line at -.10 add column annual dividend yield ] |
| four 5,087 posts msg #133059 - Remove message modified |
12/5/2016 6:20:37 PM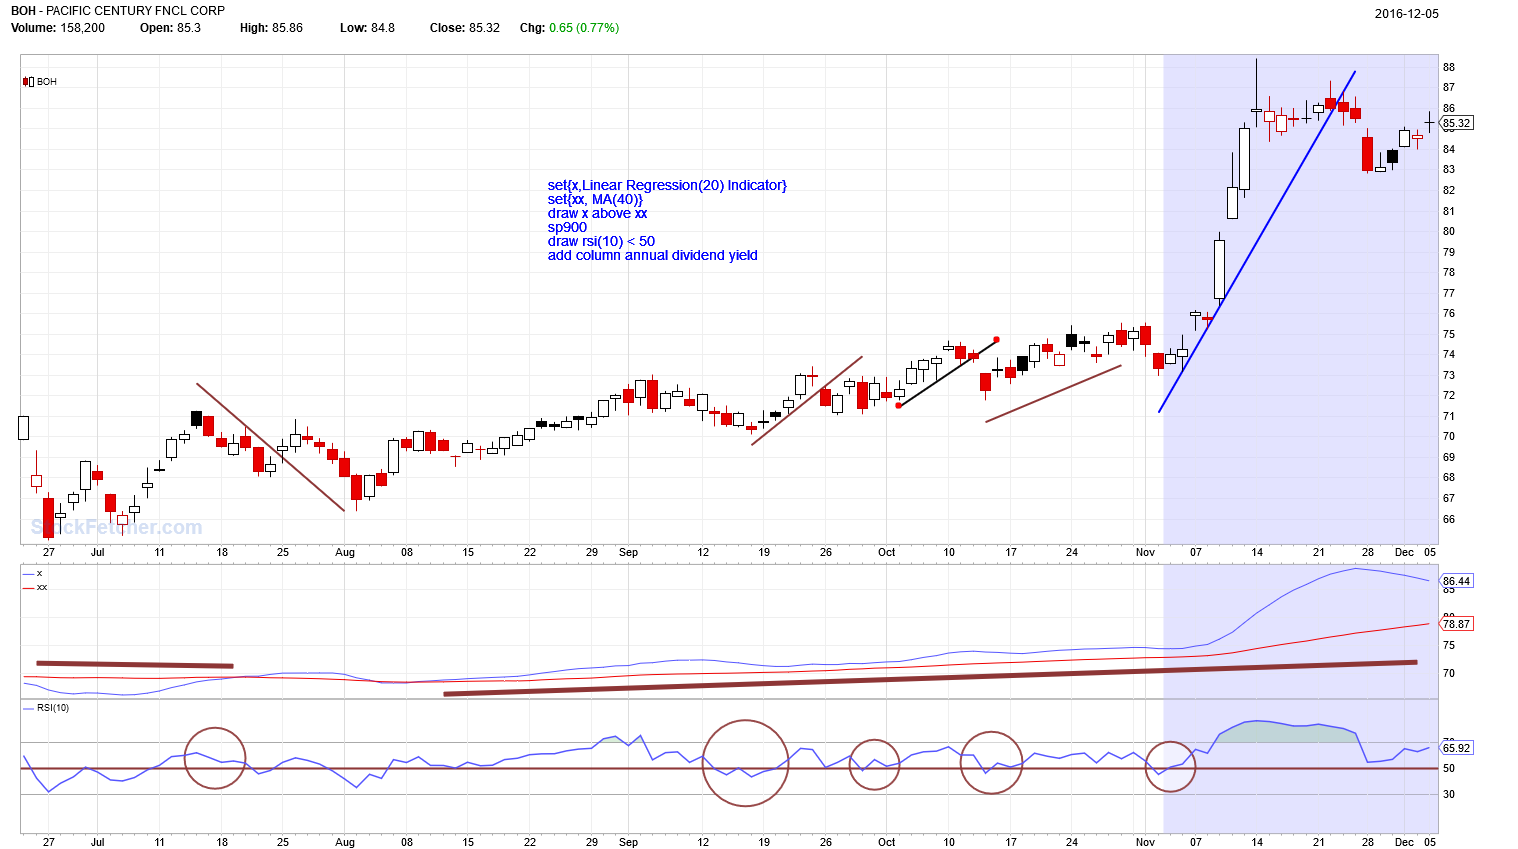 |
| four 5,087 posts msg #133066 - Remove message |
12/5/2016 9:04:23 PM tugga82 12 posts msg #133057 - Ignore tugga82 12/5/2016 12:41:00 PM -- How? I would place stoplimit buy order at high 1 day ago + .02. If it doesn't trade, cancel order and place the next day--in other words, follow the stock price down until an order is bought. I only trade stocks with dividends of over 1% (99.999999% of the time). The other piece is when to get out--there are a million ways to get out for a win AND for a loss. AND remember to manage your money against risk of ruin... etc Remember to know what your system will do before entering the trade and then follow the process for the ride or the exit. Position Sizing... etc Read and listen to Michael Covel material: http://www.trendfollowing.com/resources/ http://www.trendfollowing.com/podcasts/ Read and listen to Ed Seykota (trend trader): http://www.seykota.com/tt/faq_index/ |
| four 5,087 posts msg #133279 - Remove message |
12/18/2016 7:02:51 PM |
| four 5,087 posts msg #133332 - Remove message |
12/20/2016 6:05:51 PM |
| four 5,087 posts msg #133376 - Remove message modified |
12/24/2016 8:16:12 AM Text book launch and climb... rsi(5) never came back to 30 ... never had a candle low below the trigger ... new entry Nov 3 [rsi9 dips below 50 when cmo55 is over 20] 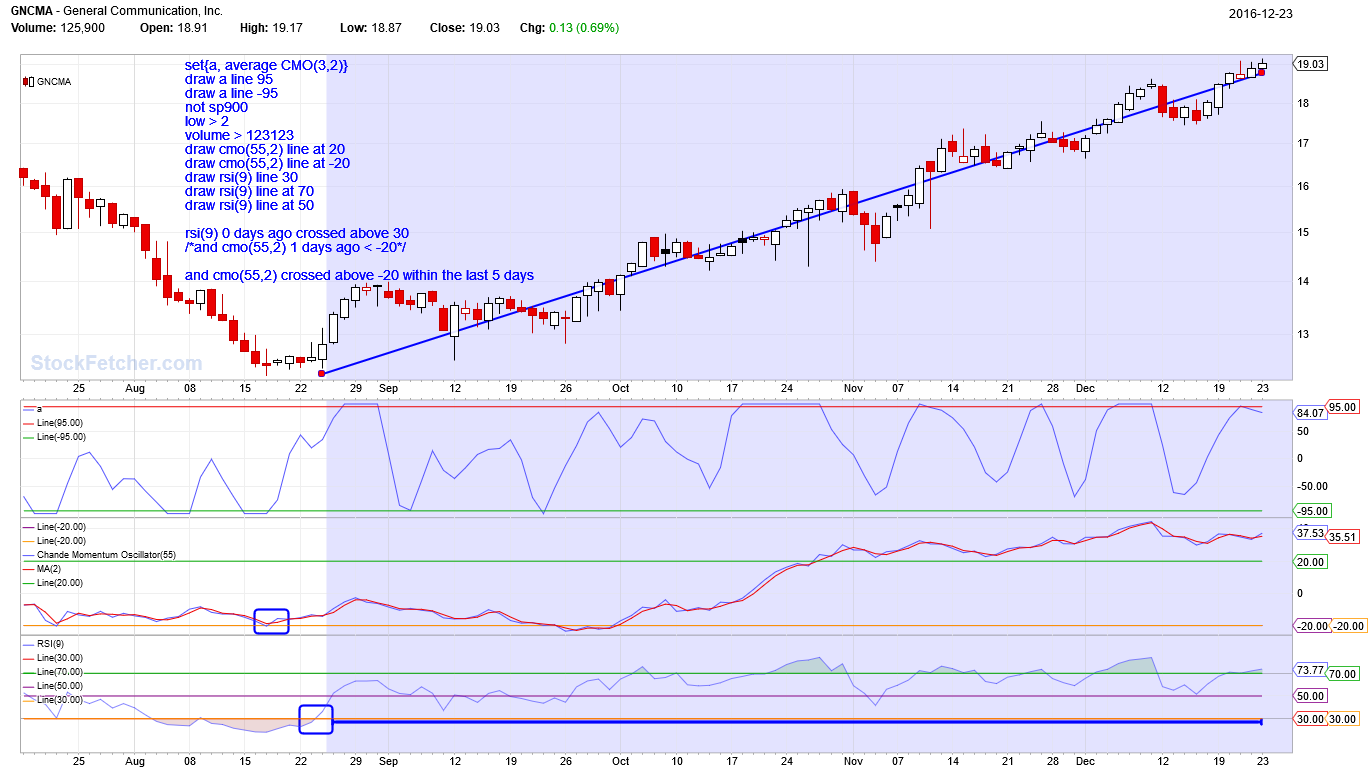 |
| four 5,087 posts msg #133377 - Remove message modified |
12/24/2016 8:46:18 AM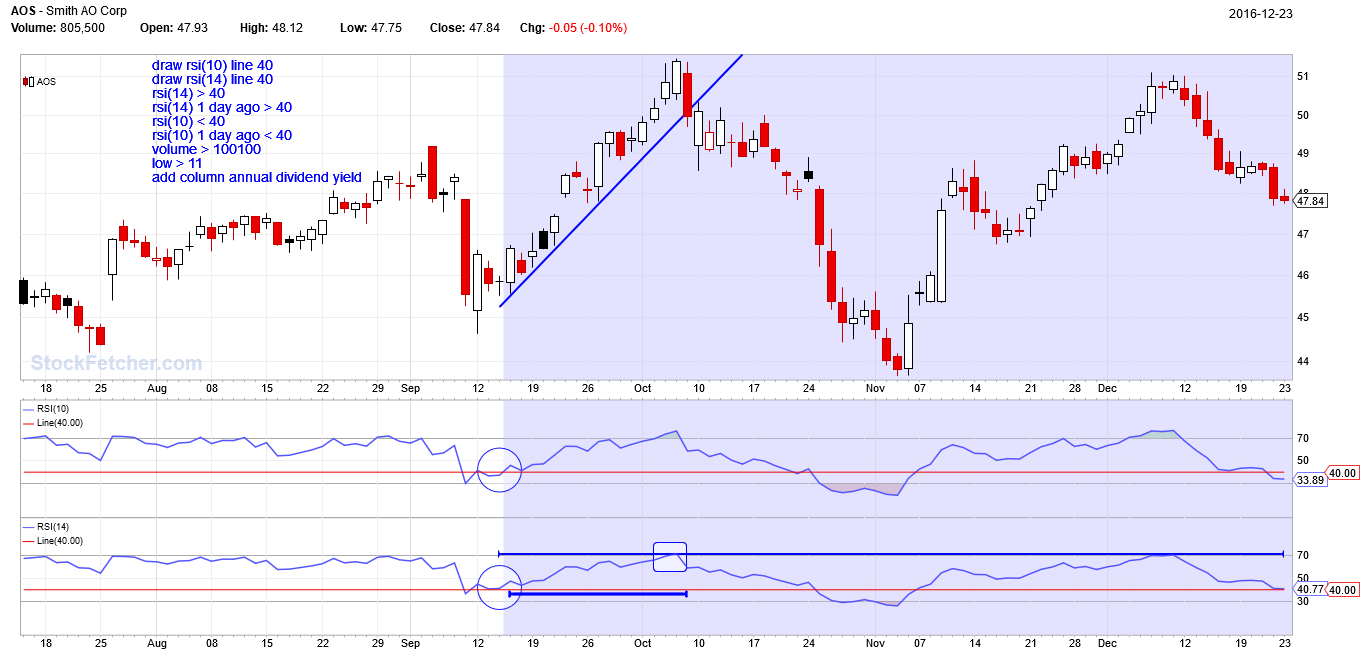 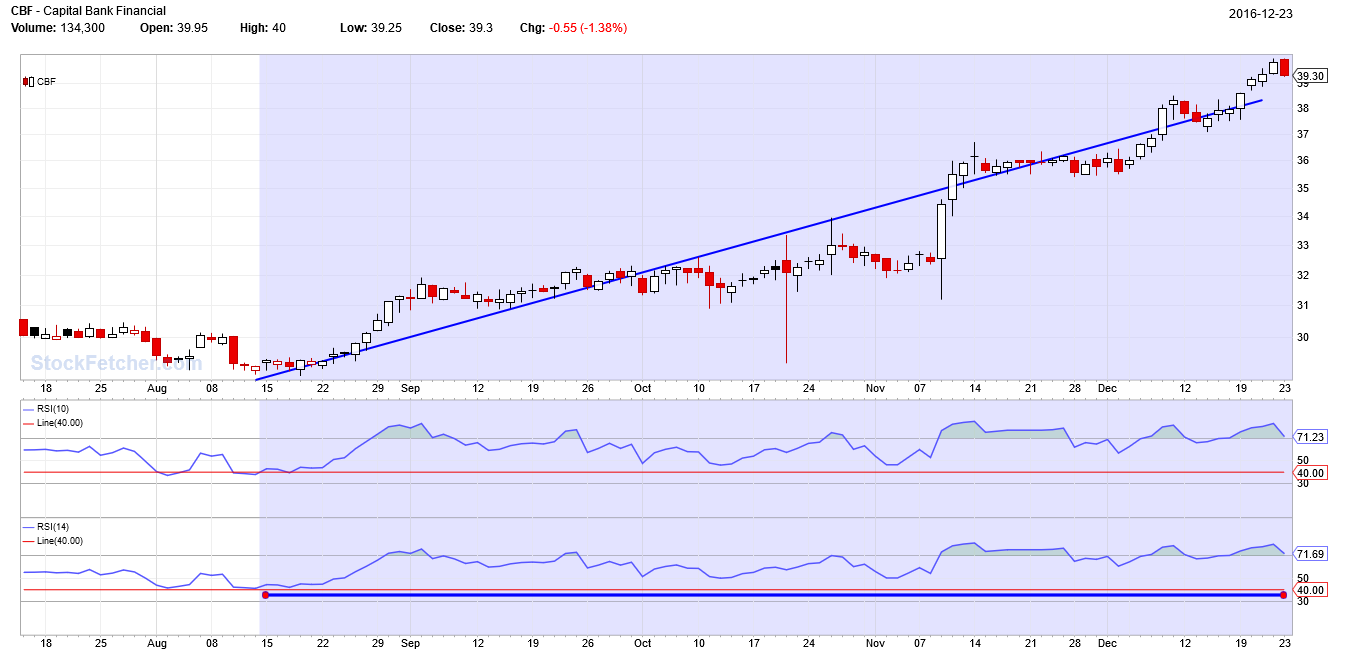 |
| four 5,087 posts msg #134054 - Remove message |
2/5/2017 1:14:21 AM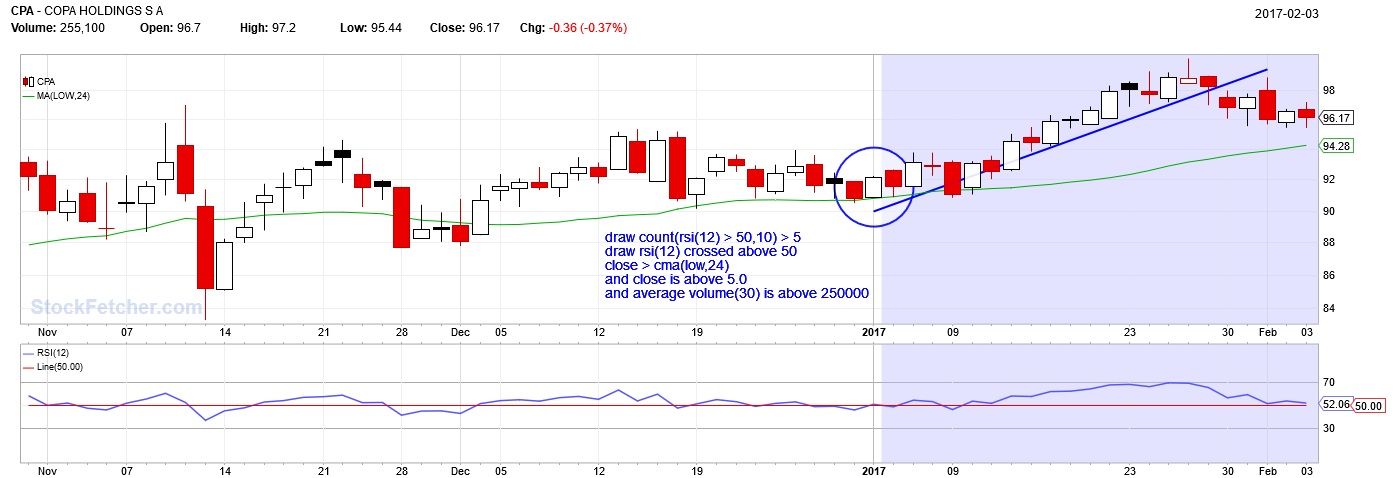 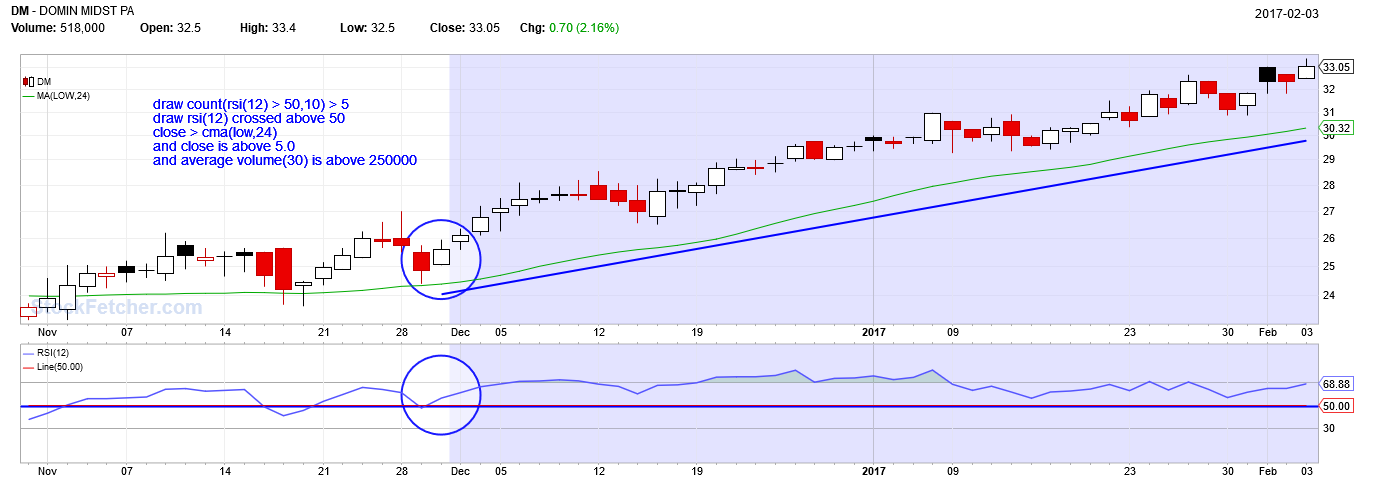 |
| four 5,087 posts msg #134246 - Remove message |
2/12/2017 10:57:01 PM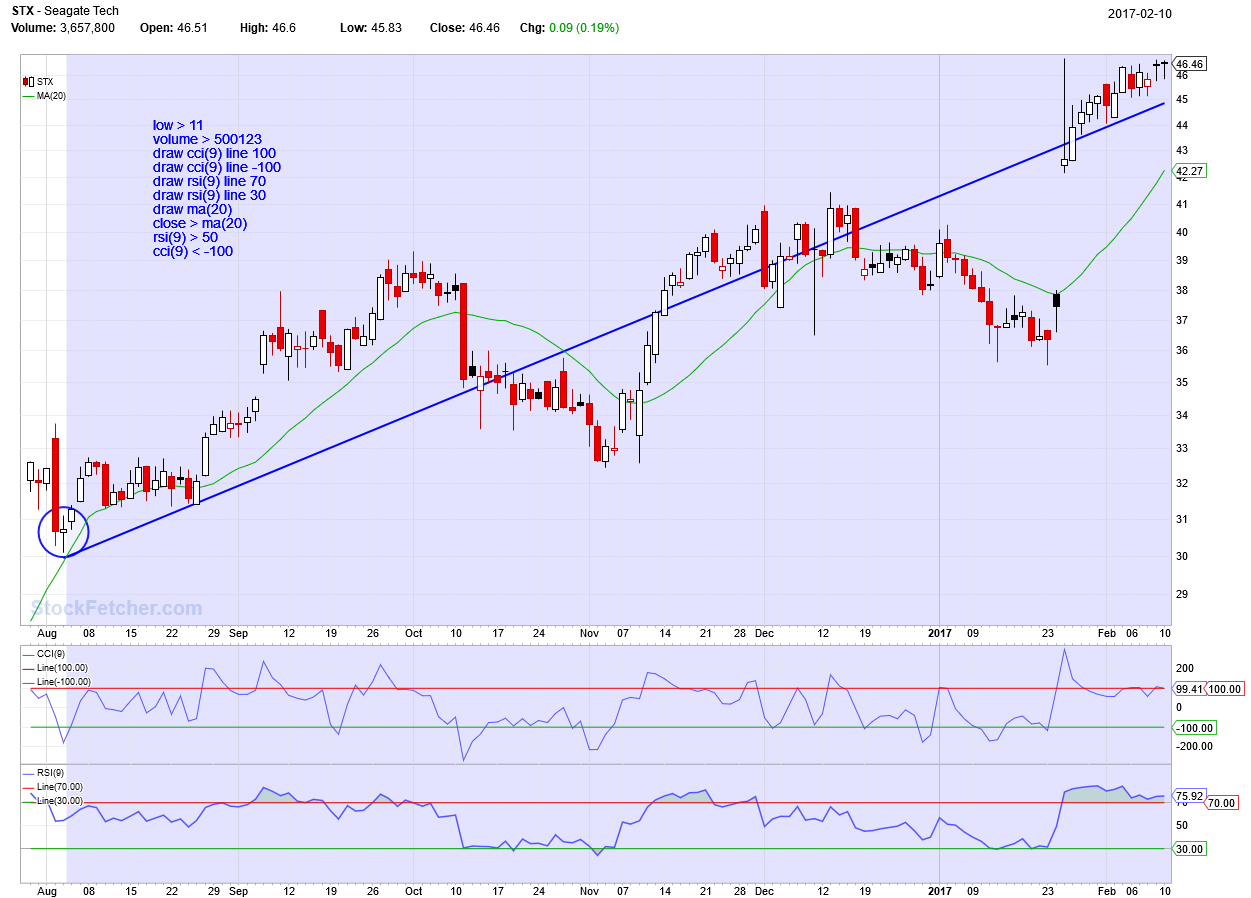 |
| four 5,087 posts msg #134393 - Remove message |
2/18/2017 12:47:17 PM |
| StockFetcher Forums · Stock Picks and Trading · Generic2 | << 1 ... 6 7 8 9 10 ... 13 >>Post Follow-up |