StockFetcher Forums · Stock Picks and Trading · Generic<< 1 2 3 4 5 ... 62 >>Post Follow-up
guspenskiy13
976 posts
msg #119364
- Remove message
5/5/2014 8:26:06 PM

thanks

four
5,087 posts
msg #119638
- Remove message
modified
5/13/2014 1:43:47 AM

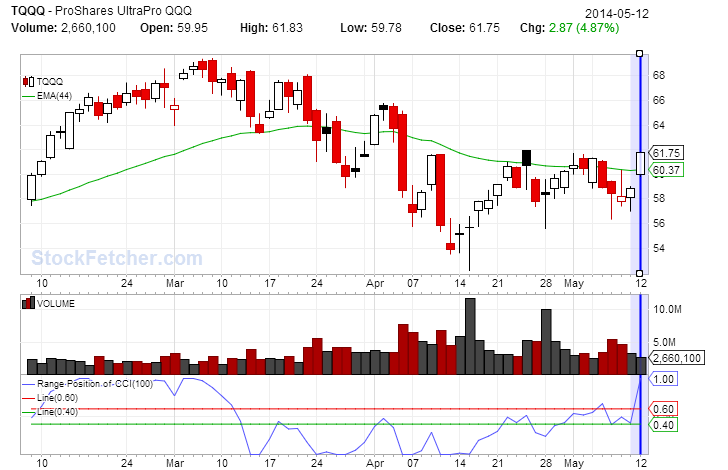
Now what? Any buyers out there?


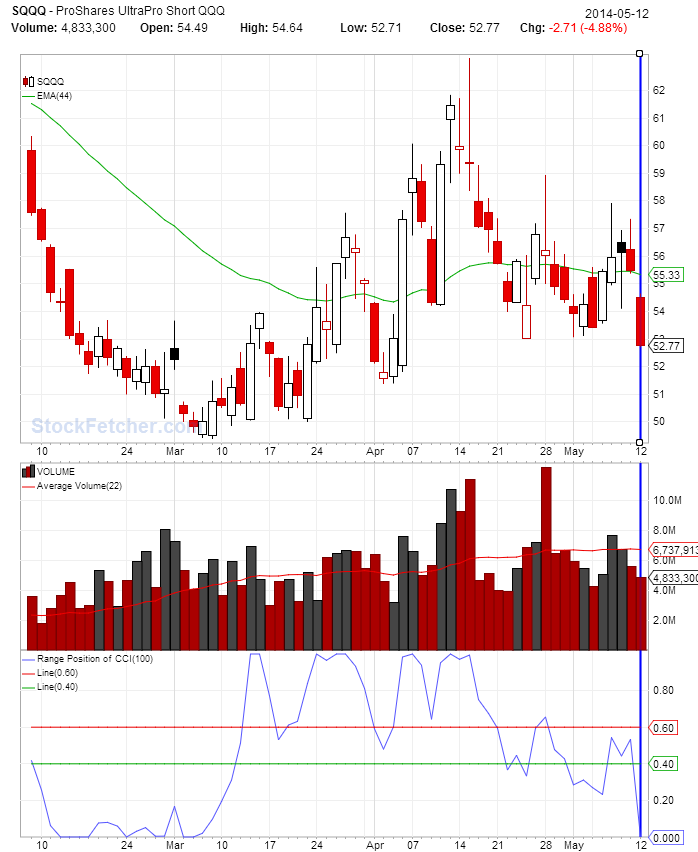
Now what? Any sellers out there?


guspenskiy13
976 posts
msg #119639
- Remove message
5/13/2014 8:37:53 AM

so now tqqq/buy sqqq/sell ?

four
5,087 posts
msg #119689
- Remove message
modified
5/13/2014 6:42:02 PM

Gus,

Criteria met. Both, were actionable, (interestingly).


four
5,087 posts
msg #119920
- Remove message
modified
5/17/2014 3:22:16 PM

Fetcher[
low > 11
volume 1 day ago > 321321
add column annual dividend yield
close crossed above ema(5)
draw ema(13)
draw ema(62)

draw ppo(5,13) < 0
draw ppo(13,62) > 0

draw ppo(5,13) line at 0
draw ppo(13,62) line at 0
]


ideas from this article: http://www.devtome.com/doku.php?id=the_5_13_62_ema_strategy
Rob Booker

four
5,087 posts
msg #119921
- Remove message
5/17/2014 3:29:01 PM

http://tfl365.com/day-17/

Nice discussion of win/loss with Excel sheet demo

four
5,087 posts
msg #119962
- Remove message
5/20/2014 11:50:58 AM

http://pensionpartners.com/blog/?p=195
PensionPartners
Efficient Markets?

four
5,087 posts
msg #119996
- Remove message
modified
5/22/2014 11:05:22 PM

Fetcher[
add column annual dividend yield
and index is russell 3000
low > 11
volume > 123123
draw cci(55) above 0
draw cci(55) line at 200
draw ema(55) < close
draw cci(11) below -200
]


Fetcher[
add column annual dividend yield
and index is russell 3000
low > 11
volume > 123123
draw cci(55) above 50
draw cci(55) line at 50
draw ema(55) < close
draw cci(11) below -200
]


Fetcher[
add column annual dividend yield
and index is russell 3000
low > 11
volume > 123123
draw rsi(55) above 30
draw rsi(55) line at 50
draw ema(55) < close
draw rsi(11) crossed above 50
]


Eman93
4,750 posts
msg #119998
- Remove message
5/23/2014 12:06:00 AM

been fooling with this one.. need to eyeball the charts and look for volume. this is based on Map Symtax on stock charts public charts.

Weekly RSI 14 over 70 is bullish...

Fetcher[
volume > 500000
Close > 1
weekly RSI(14) crossed above 70 in last1 days
ma(20) > ma(50)

close > weekly ma(20)

add column weekly ma(20)
add column weekly RSI(14)
add column RSI(14) 1 day ago
add column RSI(2)
add column high
add column industry
Display weekly chart
]


four
5,087 posts
msg #120045
- Remove message
5/23/2014 8:20:36 PM

Fetcher[
rsi(3) crossed above x
set{x, .3 * rsi(9)}
draw x on plot rsi(3)
low > 11
volume > 321321
]


StockFetcher Forums · Stock Picks and Trading · Generic<< 1 2 3 4 5 ... 62 >>Post Follow-up

*** Disclaimer *** StockFetcher.com does not endorse or suggest any of the securities which are returned in any of the searches or filters. They are provided purely for informational and research purposes. StockFetcher.com does not recommend particular securities. StockFetcher.com, Vestyl Software, L.L.C. and involved content providers shall not be liable for any errors or delays in the content, or for any actions taken based on the content.


Copyright 2026 - Vestyl Software L.L.C.•Terms of Service | License | Questions or comments? Contact Us
EOD Data sources: DDFPlus & CSI Data Quotes delayed during active market hours. Delay times are at least 15 mins for NASDAQ, 20 mins for NYSE and Amex. Delayed intraday data provided by DDFPlus


This site is protected by reCAPTCHA and the Google Privacy Policy and Terms of Service apply.