Mactheriverrat
3,178 posts
msg #131104
- Ignore Mactheriverrat
modified |
9/12/2016 12:46:56 AM
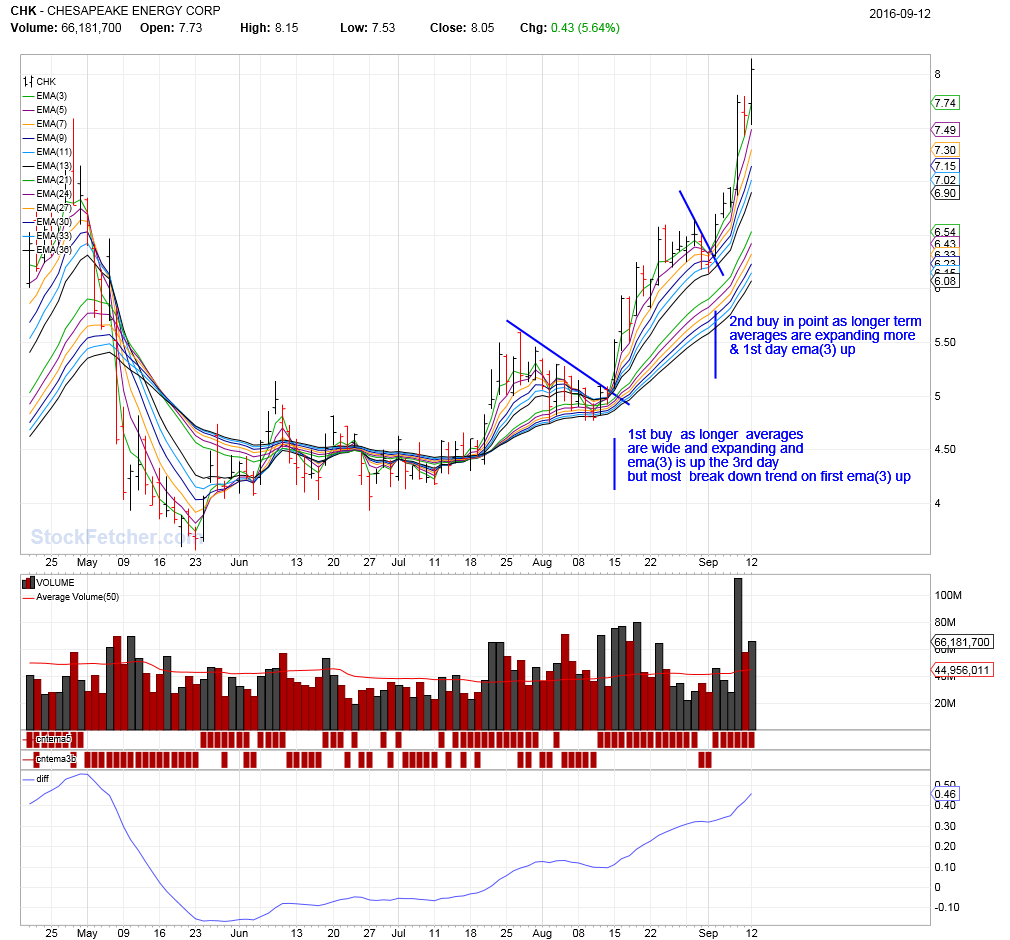
Visual chart perspective
Been messing with this for some time . Just starting to get the hang of it. I cold even take away the RSI(14) from the CHK chart. It shows where the good times are to get in.
Just saying!
I've been playing around with Sector(Medical) and Average day above 3.00. I have noticed that those posting on other sites like twitter, stock twitts of stocks that are resistance breakouts often miss the true trend strength.
|
Mactheriverrat
3,178 posts
msg #131123
- Ignore Mactheriverrat |
9/12/2016 5:37:04 PM
Should have went with CHK and not DUST.

|
pthomas215
1,251 posts
msg #131125
- Ignore pthomas215 |
9/12/2016 7:51:53 PM
I pulled up chk today and thought the same thing. DUST did something not so common after pre market so dont beat yourself up. it was up all friday, chart looked great, up in pre market...then turned due to most likely short sellers covering their positions today to close out.
|