| StockFetcher Forums · General Discussion · Thoughts on whether 2 day market correction will continue this week?? | << 1 2 >>Post Follow-up |
| pthomas215 1,251 posts msg #128269 - Ignore pthomas215 |
5/1/2016 2:25:55 PM Energy and Oil have been going with the overall nasdaq/dow/s&p. The US Dollar is thought to be tied to the overall market. Sell in May and go away???? http://www.zacks.com//stock/news/215589/sell-in-may-absolutely?%20Absolutely! |
| Mactheriverrat 3,178 posts msg #128270 - Ignore Mactheriverrat |
5/1/2016 2:42:37 PM If you have a chart (Freestockcharts,com) that shows interday price look at a hourly and 5 minute chart the last hour using MA(4) , MA(10) , MA(20) Bollinger Band(20,2) and Volume. See XIV and ever SPY the last hour. Looks like the Bears TVIX was going down the last hour. Big money seems to know what direction the market is going. My bet is up bullish or doji candles for SPY and XIV. Just saying. |
| pthomas215 1,251 posts msg #128271 - Ignore pthomas215 |
5/1/2016 2:54:35 PM Really helpful. Thank you. do you run that query daily usually to determine pre market conditions? |
| novacane32000 331 posts msg #128272 - Ignore novacane32000 |
5/1/2016 2:54:48 PM SPY--The first trading day of May has seen 17 winners and 6 losers since 1993. Overall, the first trading day has outperformed the market and for whatever reason,especially in May. Also, in an up market, buying dips has worked about 78% of the time since 1993 . So I like a quick one day trade Monday on SPY. After that ,quick trigger on everything except Silver and Gold. |
| Mactheriverrat 3,178 posts msg #128273 - Ignore Mactheriverrat modified |
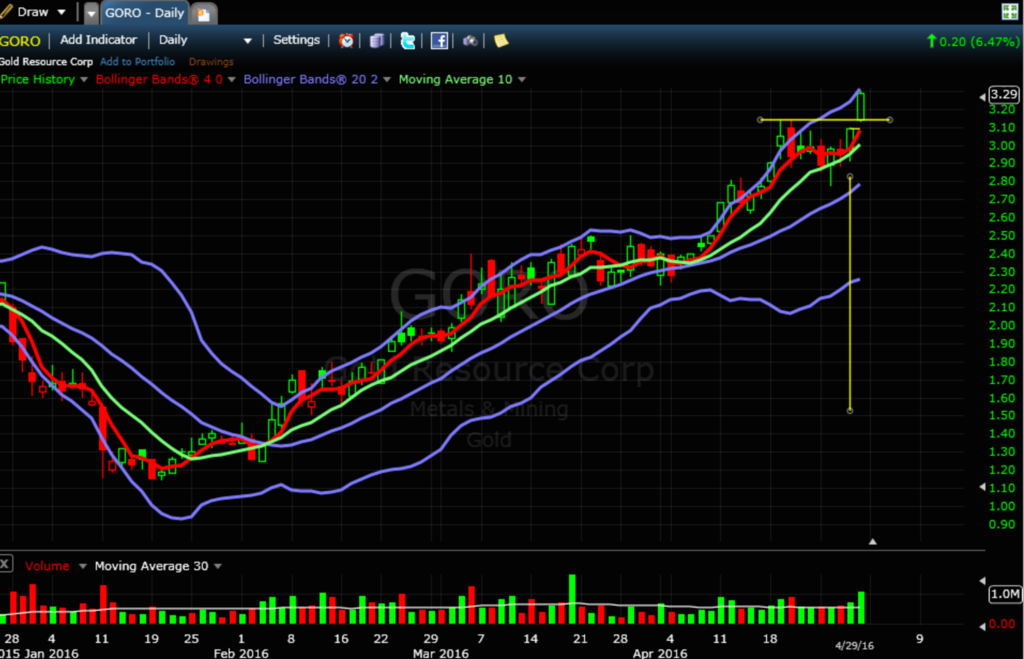
5/1/2016 3:25:04 PM Read on another site where UVXY setting up as a good short. Just saying! No on the query daily. Buying on dips is really been good . Got in on GOVO on a pull back Thursday. 
|
| pthomas215 1,251 posts msg #128276 - Ignore pthomas215 |
5/1/2016 5:48:41 PM Nice. I am guessing you got in GORO around 2.90 on Thursday and rode it to 3.20 or so Friday? Thanks to both of you. Great historical info !! |
| pthomas215 1,251 posts msg #128277 - Ignore pthomas215 |
5/1/2016 6:35:21 PM Since you guys have been helpful, I wanted to share with you something. I track a ton of energy and oil stocks. When they were all tanking Thursday and Friday, for some reason seadrill (sdrl) has surged in spite of it all. It was the only one that did. The RSI is probably getting to be a little high but you may be able to get some play out of it Monday and Tuesday. |
| papagatorga 124 posts msg #128317 - Ignore papagatorga |
5/4/2016 5:33:37 PM Look at QLD and QID. I have a Williams%R scan that has been very positive. My scan from last Wed (one week) reflects all 25 stocks on first page as LOSERS. Am buying EUM and EEV. |
| Mactheriverrat 3,178 posts msg #128319 - Ignore Mactheriverrat |
5/4/2016 7:08:24 PM Found a good Video is which they use the EMA(9). Something to study! Submit |
| Mactheriverrat 3,178 posts msg #128320 - Ignore Mactheriverrat |
5/4/2016 7:08:48 PM |
| StockFetcher Forums · General Discussion · Thoughts on whether 2 day market correction will continue this week?? | << 1 2 >>Post Follow-up |