ahcsim72
151 posts
msg #129577
- Ignore ahcsim72 |
7/3/2016 11:55:49 PM
Can someone please explain this filter in simple English?
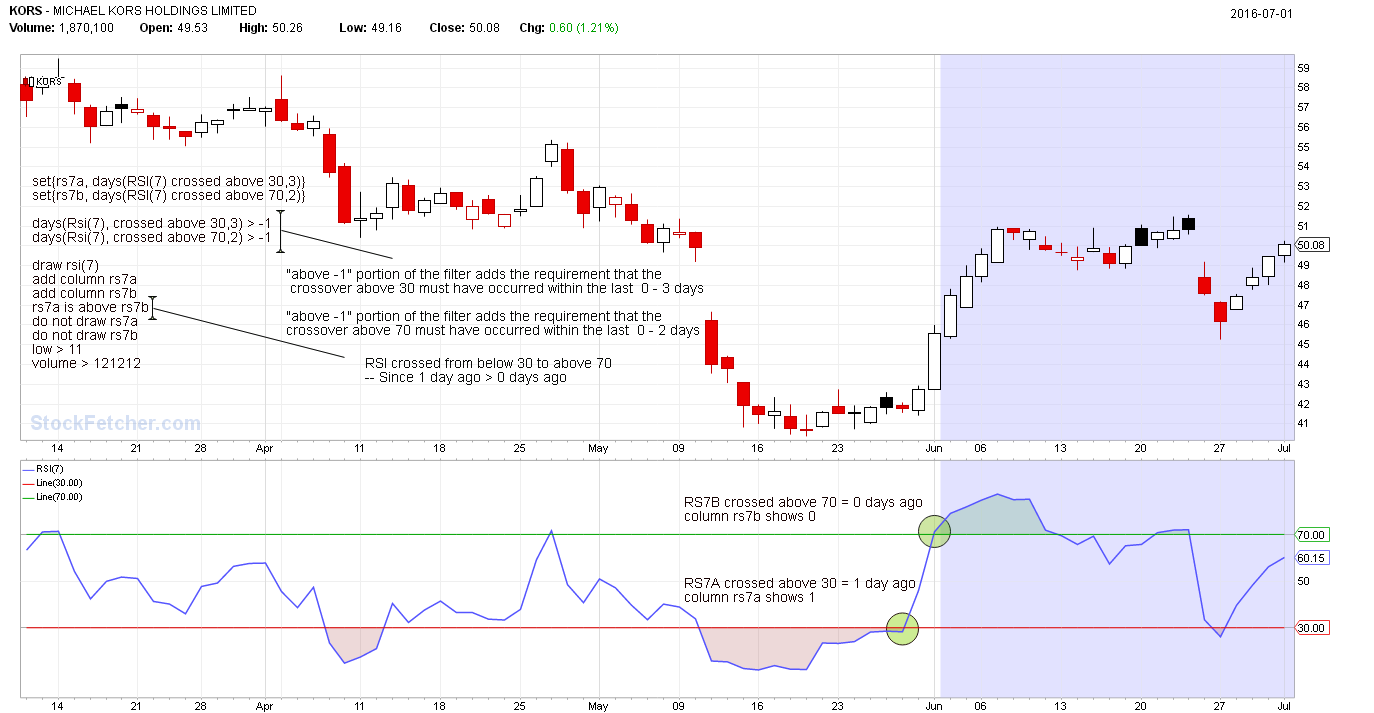
show stocks where days(RSI(14) crossed above 30,10) is above days(RSI(14) crossed above 70,10)
and days(RSI(14) crossed above 70,10) is above -1
..and one more,
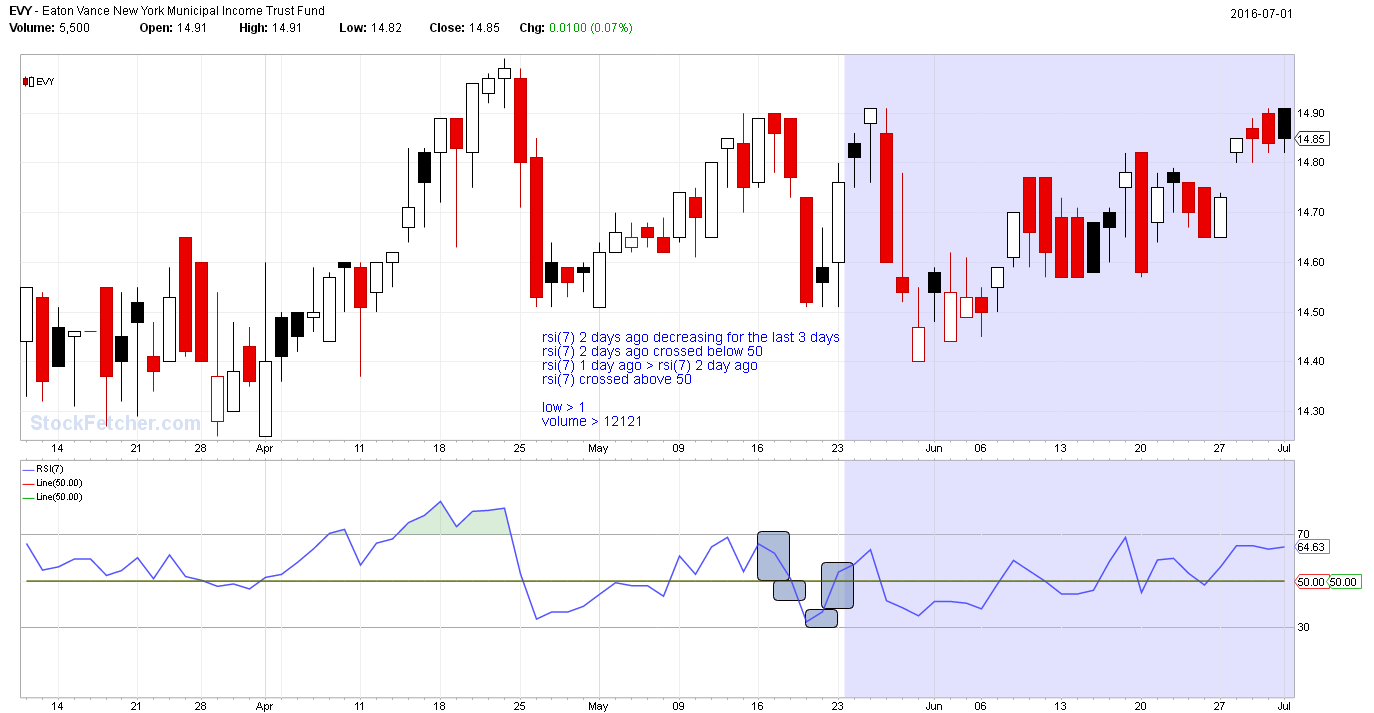
How can I see stocks with RSI(X) in decreasing trend that dipped under line 50 2 days ago, but started heading north 1 day ago, and crossed above 50 today... thanks in advance.
|
four
5,087 posts
msg #129578
- Ignore four
modified |
7/4/2016 1:13:39 AM
Here is my attempt. I changed your example to make sure an actual filter result occurred. Click on the chart for the explanation. The clickable filter is below.

|
four
5,087 posts
msg #129579
- Ignore four
modified |
7/4/2016 1:24:53 AM
Here is my attempt.
RSI(X) in decreasing trend that dipped under line 50 2 days ago, but started heading north 1 day ago, and crossed above 50 today

|
ahcsim72
151 posts
msg #129580
- Ignore ahcsim72 |
7/4/2016 3:02:00 AM
Four, this is great!! I wish I am as good as you in creating filters. Thanks for your time and effort. I really appreciate your work!
|
four
5,087 posts
msg #129582
- Ignore four |
7/4/2016 11:48:59 AM
welcome
|