| StockFetcher Forums · General Discussion · Identifying divergences | << 1 2 >>Post Follow-up |
| vicspics 1 posts msg #351 - Ignore vicspics |
1/24/2003 6:04:21 AM Is there any way to identify devirgences between indicator and price;e.g., current price is at least 10% below the price low of 20 to 40 days ago and the value of RSI is 40% greater than the range of RSI value of 20 to 40 days ago. Many happy returns vic |
| tomb 267 posts msg #354 - Ignore tomb |
1/24/2003 7:42:30 PM Hi Vic, I believe we should be able to create the filters you are looking for. Below are a couple examples The example above looks for stocks where the close today was more than 10% below the 20-day low from 20-days ago. Here is a filter for your second case: Unfortunately, I had to add the "draw RSI(14)" phrase to the first part of that example due to a charting bug. We will fix that problem and in the future, the "draw RSI(14)" command will not be necessary. Hopefully those two examples do what you are looking for, if not, don't hesitate to let us know! Thank you, Tom StockFetcher.com Support |
| defghca 150 posts msg #409 - Ignore defghca |
2/6/2003 7:41:35 AM unfortunetly your rely was incomplete, there is also a request for a range filter "than the range of RSI value of 20 to 40 days ago" |
| faraway 16 posts msg #425 - Ignore faraway |
2/7/2003 6:55:29 AM Won't the second filter that Tom provided produce what you're asking for? |
| four 5,087 posts msg #129828 - Ignore four modified |
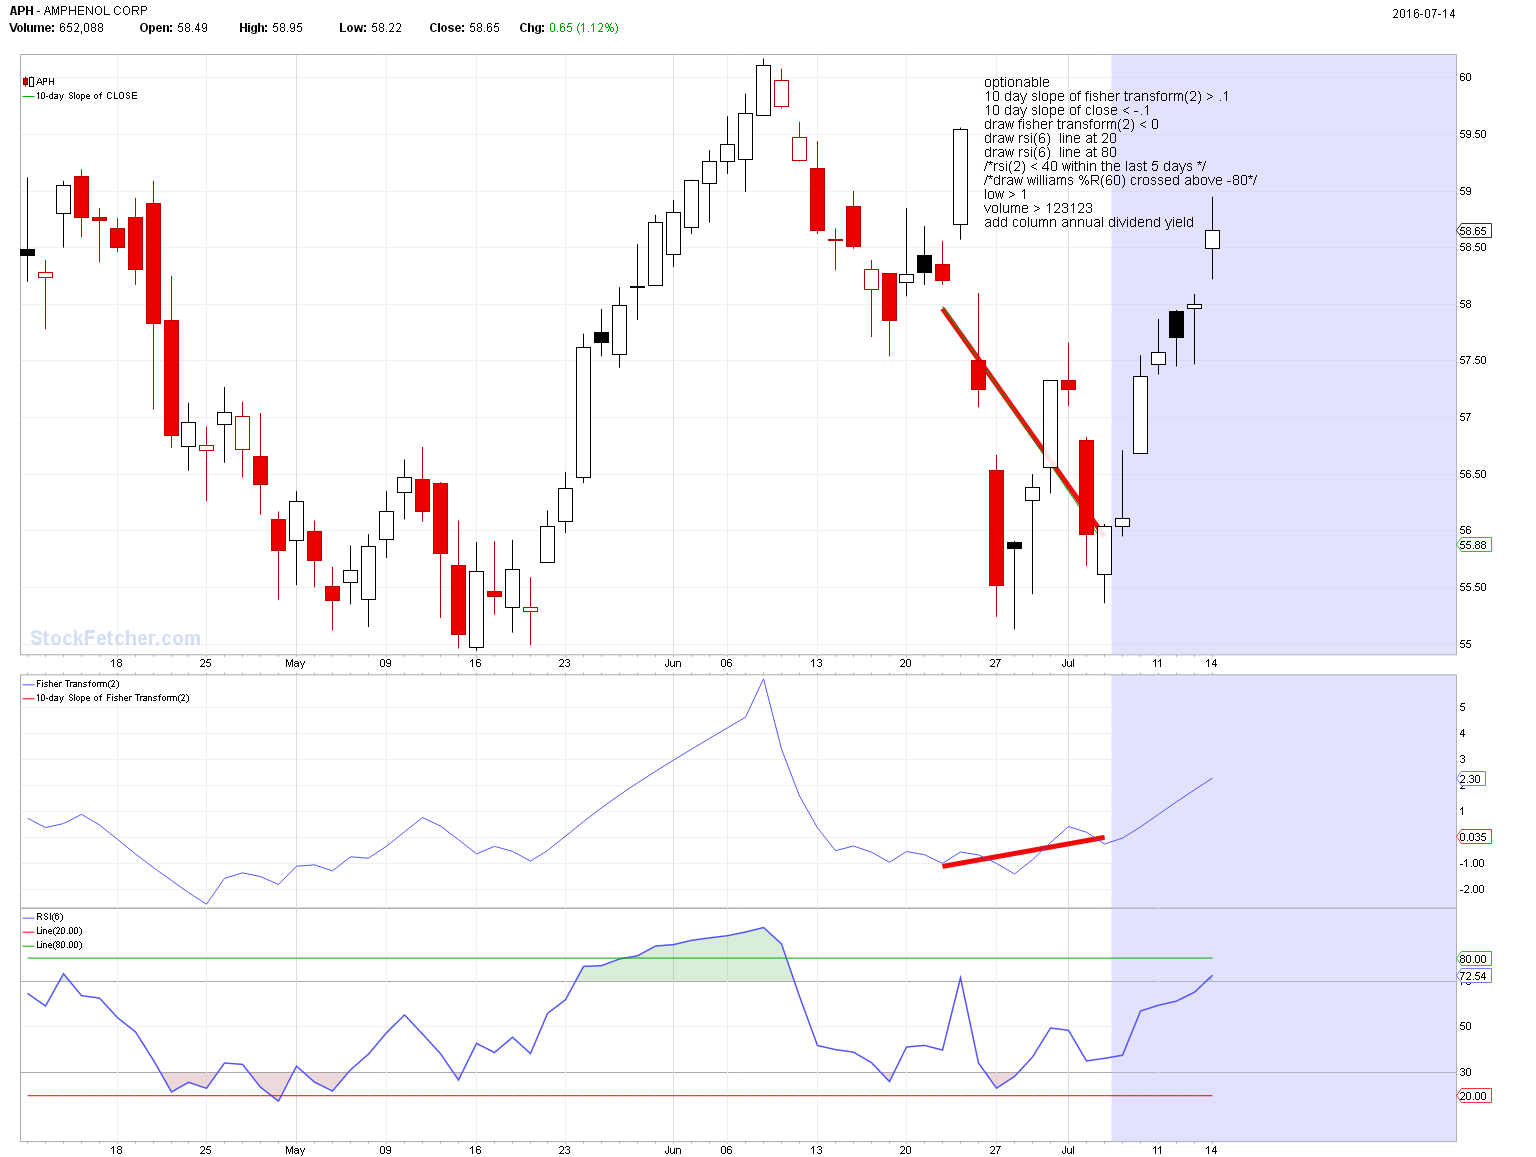
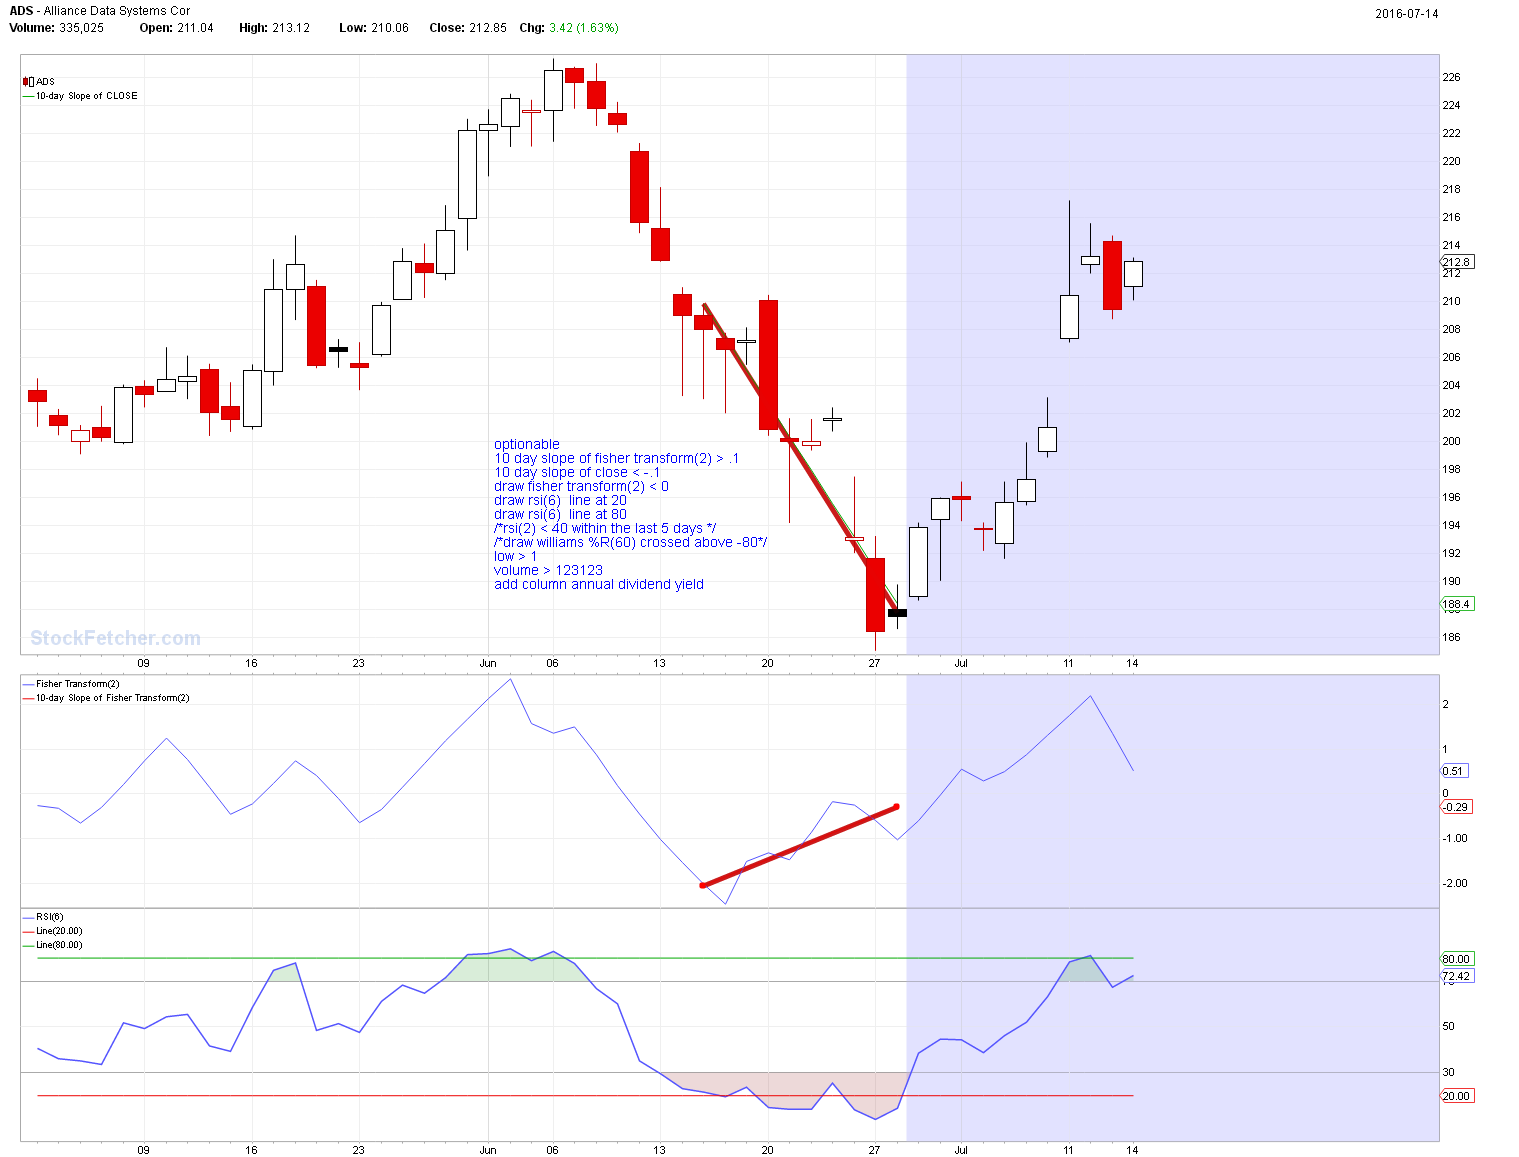
7/14/2016 2:37:30 PM For Divergence fans   |
| pthomas215 1,251 posts msg #129832 - Ignore pthomas215 |
7/14/2016 10:13:37 PM Four, you are a genius with this stuff. With your divergence filter, does higher volume necessarily translate into a greater bump up or doesn't it matter? |
| four 5,087 posts msg #129834 - Ignore four |
7/14/2016 11:22:25 PM " does higher volume necessarily translate into a greater bump up or doesn't it matter" -- I haven't investigated volume... if you are interested, here is a full page of volume information and links to "related articles" at the bottom. http://www.investopedia.com/articles/technical/02/010702.asp ---- PS Thank you for the compliment. |
| peter941221 4 posts msg #129858 - Ignore peter941221 |
7/17/2016 10:58:12 AM Four, thank you for your filter. How do you calculate the entering time? I found some results that there would be one or two more days of dropping, and then pop up. Thanks. |
| four 5,087 posts msg #129859 - Ignore four modified |
7/17/2016 1:00:35 PM peter, Note: I have not traded this filter. Remember during a bull market almost any long filter will have money making potential Remember during a bear market almost any short filter will have money making potential First: We know that no filter will give a 100% win rate Second: We know that each person has an individualized threshold of pain (draw down and the like) -- SO... Recently (using hindsight 20/20),I would {curve fit} the stop-loss on a non-dividend stock and not get out until 3 candles had highs that were below the low of the entry candle. A dividend stock (anything paying over 2%) let it ride. Entry Option: Only buy the High + some value (1 or 2 cents) with a stop-limit order You get the idea. Importantly, how will you manage your winners and losers. Ed Seykota says and the second video is some humor. |
| peter941221 4 posts msg #129865 - Ignore peter941221 |
7/17/2016 6:29:41 PM Four, thank you so much! |
| StockFetcher Forums · General Discussion · Identifying divergences | << 1 2 >>Post Follow-up |