alexchambers
8 posts
msg #131680
- Ignore alexchambers |
10/2/2016 2:31:22 PM
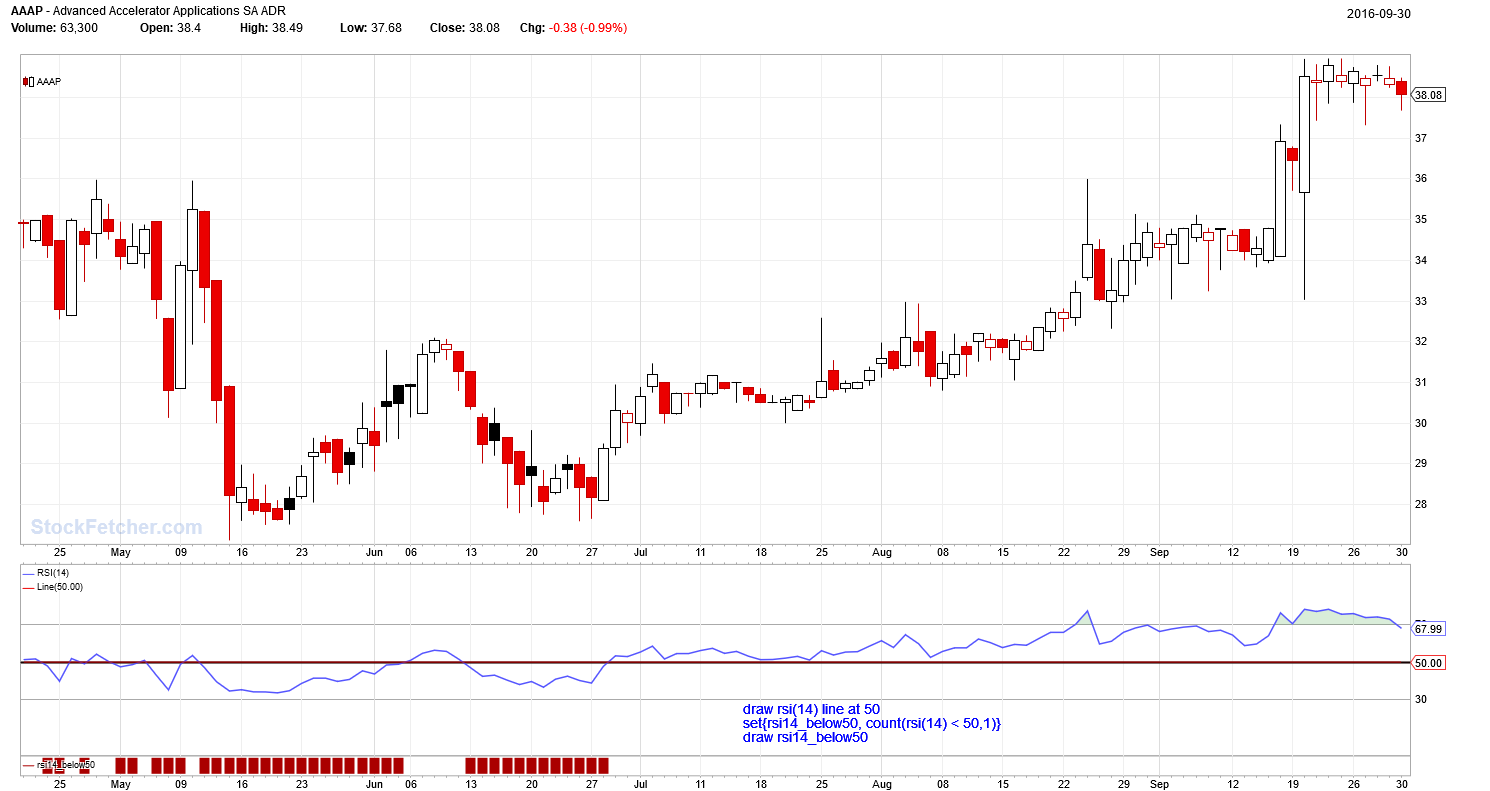
Hi - is it possible to show the filter results displayed graphically on the chart, eg:
If the output from the whole filter is TRUE, then this is a 1 - otherwise a zero - and plot this variable under the chart.
Thanks :)
|
four
5,087 posts
msg #131682
- Ignore four
modified |
10/2/2016 2:38:30 PM
Have you investigated:
http://www.stockfetcher.com/sfhelp2/?id=100379
Click chart...

|
alexchambers
8 posts
msg #131702
- Ignore alexchambers |
10/3/2016 12:59:29 PM
Thank you - very helpful.
I used those coding principles with several variables, but am having some code errors - what would they be?
(I am using variable V4 to summate all the conditions required for this filter, so if I draw V4 it will show how many of them are positive for each bar)
set{P1, close is above 15}
set{P2, average volume(20) is above 80000}
set{P3, close is above MA(150)}
set{P4, MA(50) is above MA(200)}
set{P5, close is below MA(30)}
set{V1, P1+P2}
set{V2, V1+P3}
set{V3, V2+P4}
set{V4, V3+P5}
stock is optionable and V4=5
|
Kevin_in_GA
4,599 posts
msg #131703
- Ignore Kevin_in_GA |
10/3/2016 1:23:19 PM
You need to use the COUNT() function. Try this
|
alexchambers
8 posts
msg #131710
- Ignore alexchambers
modified |
10/3/2016 3:57:58 PM
Perfect. Thank you once again :)
If I wanted to show stocks where V4 was above 4 anytime in the past 7 days, would this work:
V4 above 4 in the past week
|
Kevin_in_GA
4,599 posts
msg #131716
- Ignore Kevin_in_GA |
10/3/2016 10:08:49 PM
Count(V4 above 4, 5) above 0
|