| StockFetcher Forums · Filter Exchange · Can someone please help with this scan | << >>Post Follow-up |
| wickcity 6 posts msg #122079 - Ignore wickcity |
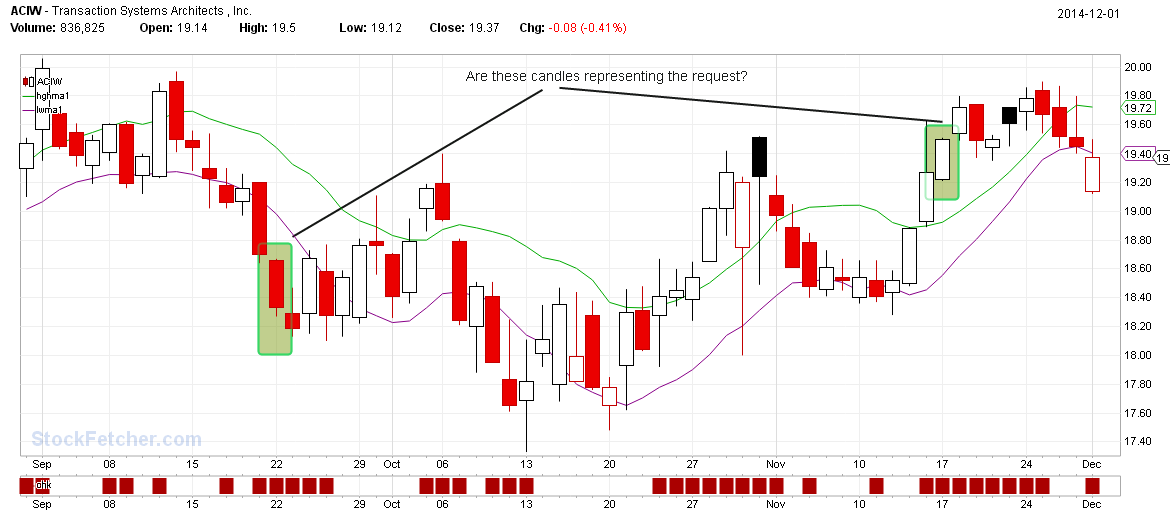
11/29/2014 1:54:11 PM it has 2 SMA's on the chart. 10 SMA based on HIGH(not close price) 8 SMA based on LOW(not close price) Then, I want to scan for a close either completely above the 10 or a close completely below the 8. Thanks in advance |
| heypa 283 posts msg #122080 - Ignore heypa |
11/29/2014 2:14:33 PM You will have to use TRO's work around for if then else to do this. Also stock fetcher uses ma not sma. |
| four 5,087 posts msg #122081 - Ignore four modified |
11/29/2014 2:23:37 PM |
| compound_gains 225 posts msg #122082 - Ignore compound_gains |
11/29/2014 4:02:14 PM |
| wickcity 6 posts msg #122095 - Ignore wickcity |
12/1/2014 7:34:01 AM Thanks so far. The closest i got so far is from compound gains. But in this scan many of the stocks in scan are either touching the MA on the top side or bottom side. The close needs to be COMPLETELY above or BELOW the MA's. |
| compound_gains 225 posts msg #122102 - Ignore compound_gains |
12/1/2014 11:57:04 AM So control for how much above or below the moving average you want it to be. I used 1% but set your own. |
| four 5,087 posts msg #122118 - Ignore four modified |
12/1/2014 4:50:15 PM " The close needs to be COMPLETELY above or BELOW the MA's" -- Do you mean "close" or do you really mean the High and Low (High or Low completely clears the MA) ?  |
| wickcity 6 posts msg #122122 - Ignore wickcity |
12/1/2014 7:06:39 PM I typed the wrong thing. Sorry about that. I mean the high and low. So if the top MA is 50.00 for example the the price can not come down and touch 50.00. It can move down to 50.01 though. For the bottom MA, if using the 50.00 number again, the high that day cannot come up to 50.00. It could come up to 49.99 |
| wickcity 6 posts msg #122123 - Ignore wickcity |
12/1/2014 7:09:28 PM Four, yes those examples are the ones i'm looking for. |
| StockFetcher Forums · Filter Exchange · Can someone please help with this scan | << >>Post Follow-up |