| StockFetcher Forums · Filter Exchange · Calling all FILTER Geniuses! **GAP FINDER** | << 1 2 3 4 >>Post Follow-up |
| Cheese 1,374 posts msg #155670 - Ignore Cheese |
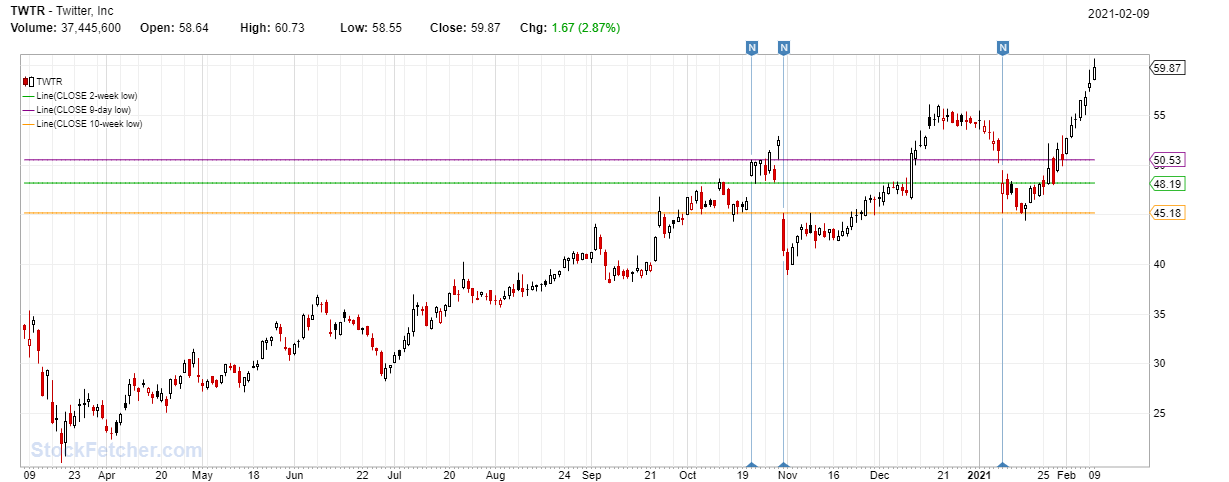
2/9/2021 9:57:58 PM karen and Ed, With indicators like Guppys, macd, %k, rsi, etc I could guess how to trade. But I am not clear on how to trade with the above filters from Ed and Marco/TRO, Could you tell how you would trade the filter picks with the above charts and stats ? Many thanks. |
| karennma 8,057 posts msg #155681 - Ignore karennma modified |
2/10/2021 7:53:27 AM @ Cheese, Re: "But I am not clear on how to trade with the above filters from Ed and Marco/TRO," ================================================================== I rarely use OPFs (other peeps filters) as they are posted. I always modify them to accommodate the way my brain works. I don't care who they are or how famous they are; 95% of the time, other peep's stuff never works for me unless I modify it. Anyway, ... The reason why I was interested in Marco's filter (GAP FINDER) was because I was taking long positions on stocks that continued to go down. So, I got "stuck" holding the bag for a period of time. For example, ... (This is just an example. I DON'T use RSI(2), but for explanatory purposes, I'll use it as a hypothetical.) Let's say RSI(2) on XYZ stock is showing a bottom, and other indicators are showing a bottom, so I buy. A few days pass and the stock continues to go down or it simply doesn't go up significantly. Either way, I'm not making money. Over time, it goes flat, consolidating for a while. So I wait. Then it goes down more. Guess what? That stock ain't going up until it fills a gap I didn't see from 3 months prior. So, let's say I bot @ $250, but there's a gap @ $197 ... 3 months ago. ;>) Now, you know -- the rest of the story. EDIT: More specifically, to answer your question - If a filter cannot be written as per my request, then the gaps on the chart will have to be eyeballed. |
| karennma 8,057 posts msg #155682 - Ignore karennma |
2/10/2021 8:26:26 AM |
| Cheese 1,374 posts msg #155685 - Ignore Cheese |
2/10/2021 10:48:59 AM @karennma, Thank you for your great explanation, Next time, when you want second opinions about your stock, you may want to check the public chart list at stockcharts. I check the top ranked authors first I also pay more attention to authors with small-size charts. Authors with small-size charts tend to use their own charts for their own trading decisions. They more likely would be busy people with real jobs who only have short breaks. They make their charts public so they don't want have to log on, The three most popular indicators seem to be: a main moving average (20 & 50 seem popular) a main macd (12,26,9 seems very popular) a main rsi (14 seems very popular) or %k (#1 Joanne Klein's %K seems best compromise) If you have favorites, bookmark them in your most preferred way for quickest access. Happy trading. |
| Cheese 1,374 posts msg #155686 - Ignore Cheese |
2/10/2021 11:05:39 AM @karennma, When you only want ONE --- just ONE --- chart for second opinion, try the chart that Mactheriverrat created for you Mactheriverrat msg #150344 1/15/2020 11:07:06 PM https://www.stockfetcher.com/forums/General-Discussion/BA/146860/50 https://stockcharts.com/h-sc/ui?s=BA&p=D&yr=12&mn=0&dy=0&id=p93352289651&a=713901353&listNum=1 Happy trading |
| nibor100 1,102 posts msg #155701 - Ignore nibor100 |
2/11/2021 10:37:21 AM @cheese, The filter I posted regarding Gaps was just to help out. I don't trade Gaps, so I'm definitely in no position to offer gap trading advice. Sorry, Ed S. |
| nibor100 1,102 posts msg #155702 - Ignore nibor100 |
2/11/2021 10:43:33 AM @karennma, To clarify what I was alluding to earlier, I ran my filter with just your example stock BYND as the sole symlist stock. It shows 21 instances of gaps in the past year greater than 4% each. So drawing 2 horizontal lines for each of those 21 gaps would clutter the chart with 42 lines. Is that really what you are looking for? Thanks, Ed S. |
| karennma 8,057 posts msg #155718 - Ignore karennma |
2/12/2021 8:45:28 AM Whaaaaa hahaha! I'm thrilled. This one IS a TRO filter. I embellished it to my liking. Here's the original. Brilliant! it gives up the gap statistically speaking in the last 100 days... Submit |
| nibor100 1,102 posts msg #155720 - Ignore nibor100 |
2/12/2021 10:39:06 AM Not sure I understand the happiness associated with this 2nd filter as opposed to the one you posted at the beginning of the thread.....since it doesn't do what you were asking for, at all, and both filters appear to be mostly using the same calculations to derive the gap absolute $ sizes. "I don't need all those columns in the filter results. I just need to see the line(s) where the gaps are on the chart. TIA! Oh! One exception ... A column with the location of the gaps would be great." Glad you found something that works for you, Ed S. |
| karennma 8,057 posts msg #155721 - Ignore karennma |
2/12/2021 10:45:26 AM Whoops! Here's the link in case anyone wants to see the original ... https://forums.stockfetcher.com/forums/Filter-Exchange/FADING-THE-GAP-STATISTICS-FILTER/45054/360 |
| StockFetcher Forums · Filter Exchange · Calling all FILTER Geniuses! **GAP FINDER** | << 1 2 3 4 >>Post Follow-up |