| StockFetcher Forums · Filter Exchange · A NEW ^VIX TRADING SYSTEM | << 1 2 3 4 5 ... 49 >>Post Follow-up |
| Kevin_in_GA 4,599 posts msg #130879 - Ignore Kevin_in_GA |
9/5/2016 6:14:55 PM I have been tinkering with Stratasearch (again) and wanted to share some of my work here at SF. It should be noted that Stratasearch has a greater range of accessible functions and indicators, as well as a more expansive ability to generate user-defined functions. Another really nice thing SS can do is to run a vast number of possible indicator combinations against a stock or set of stocks over any defined time period. This brute force calculational approach usually discovers lots of interesting results that can be profitably traded, but there are many times when the results of a Stratasearch optimzation cannot be directly translated into SF code. I decided to use this approach to find trading strategies against the ^VIX index over the last 5 years (from 9/1/2011 through 9/1/2016). During this time the ^VIX mostly went DOWN, not UP so one would expect a lot more short strategies than long ones. I allowed SS to run over 2 million different combinations of indicators, requiring only that the results 1. Have a win % of 90% or higher 2. Have completed at least 20 trades over the 5 year period, and 3. Be held no longer than 10 days My objective was to find 10 successful long and 10 successful short ^VIX trading strategies that meet these requirements, and to combine them into a single trading system which allocates equal portions of your equity to each strategy, trading that portion only when a signal for that strategy is triggered. The entire screening process (over 2 million different combinations) only took about 24 hours since it was against a single set of index data. I looked for systems that had high Sharpe ratios and high annual returns. I also wanted to be sure that the entry signals were not just very minor variations of a single trigger - each had to employ a unique entry signal to be included in the final multi-system. All trades were entered as market orders at the open of the day after the signal was triggered - same for trade exits. Since these are independent strategies each has its own entry and exit signals, and often you will be holding both long and short positions on the index at the same time (again, each system is independent of the others and does not know or care if you are holding the opposite position as well since both are valid trades). PART I: FIRST, THE RESULTS ... The equity curve: 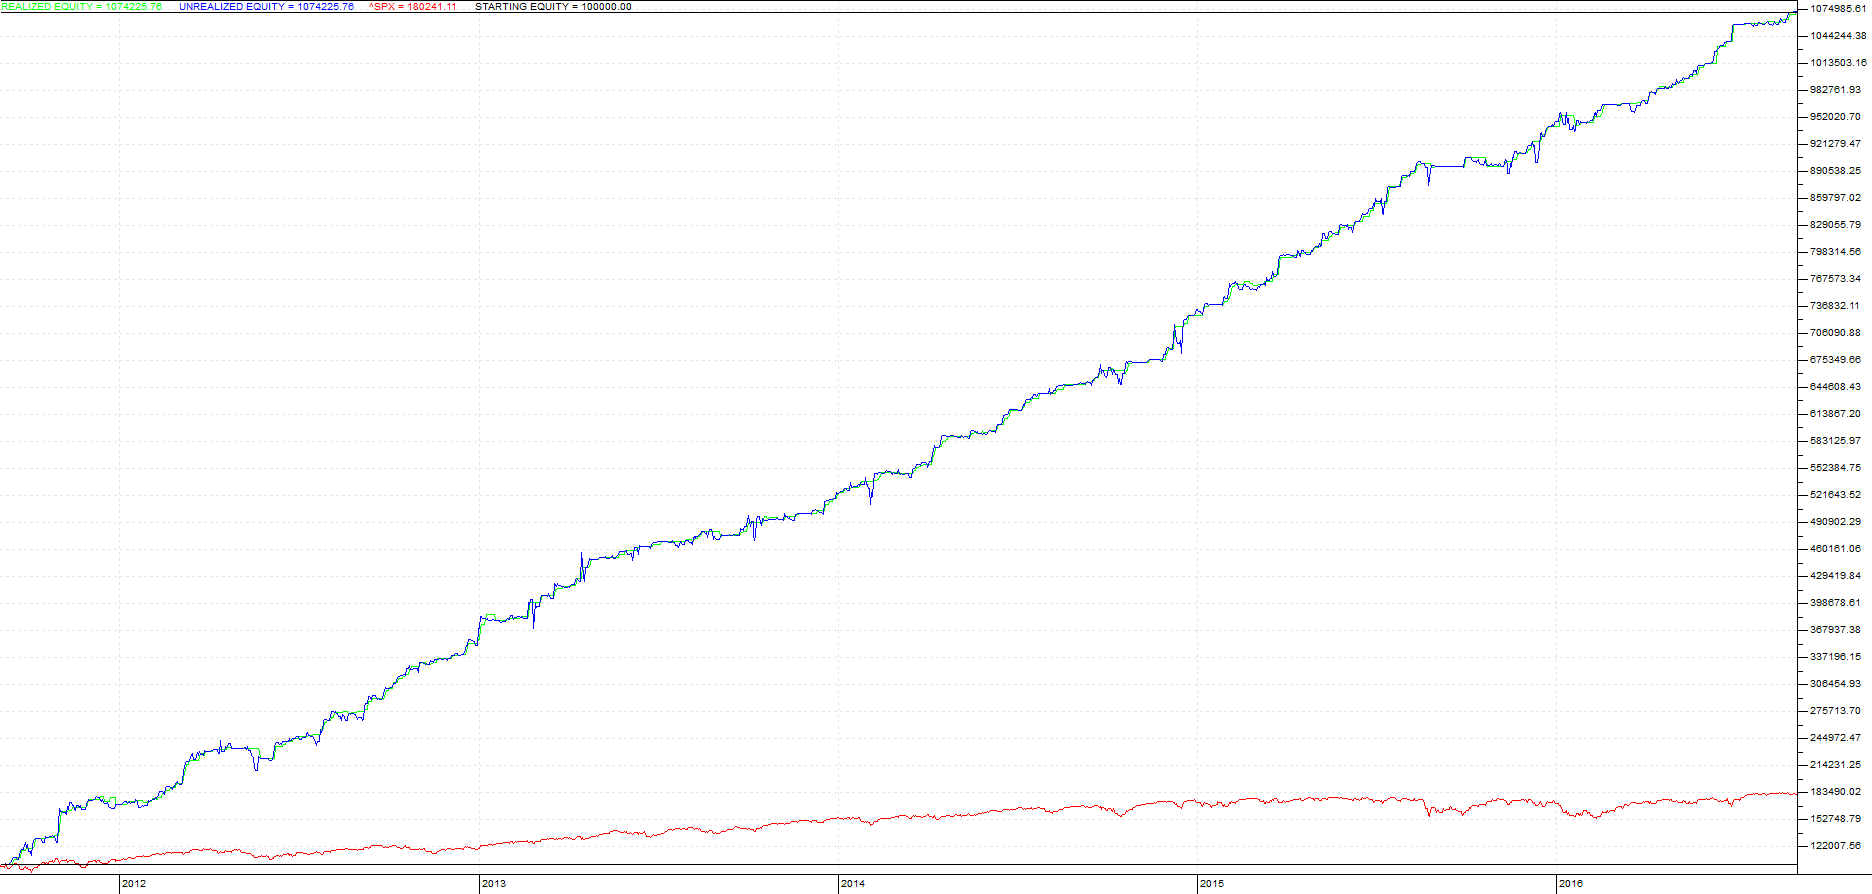
The system results are in blue, while the S&P 500 returns for the same time period are displayed in red. The stats: 
And the absolute number of open positions at any time during the test period: 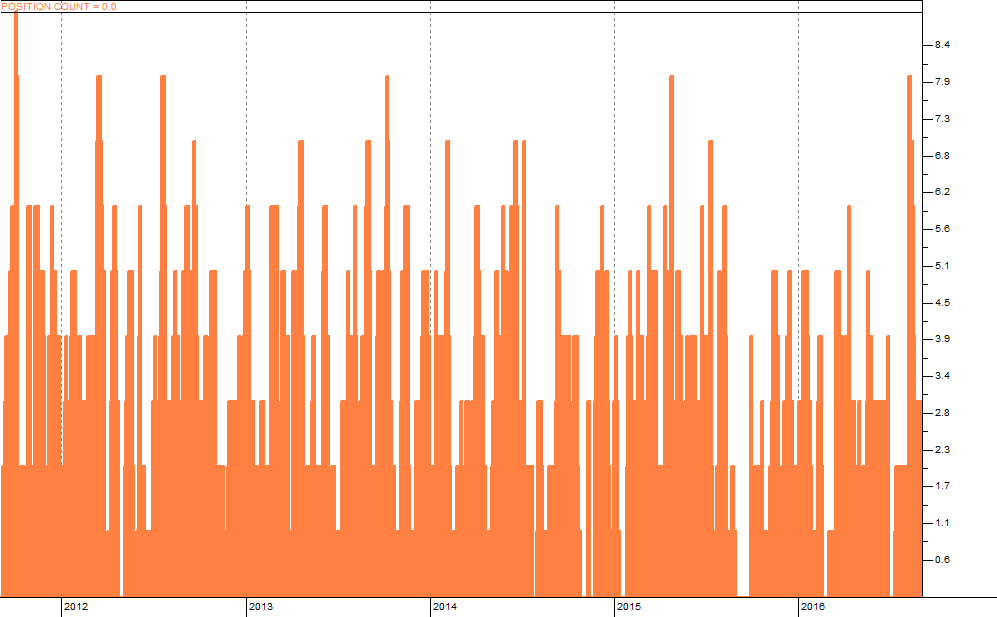
This is actually pretty important - my initial thought was that I would divide my investment funds into 20 "slices" and only trade a slice when the corresponding filter triggered, but looking at the position counts it is very clear that if I did that I would be trading only a fraction of my available capital - it looks like the system rarely had more than 5 positions open at any time, so you make the best returns just trading five units whenever ANY filter triggers. A REALLY IMPORTANT POINT TO MAKE: THE SYSTEM SIGNALS ARE TRIGGERED BY THE VIX INDEX - YOU HAVE TO MAKE THE TRADES USING A SURROGATE (EITHER OPTIONS, FUTURES, OR ETFs/ETNs). The results seen here are for the ^VIX index, which cannot be traded. Instead, you will have to use these signals to trade either options, futures, or one of several ETFs/ETNs that try to track the index. For most of us, the easiest thing to trade are the ETFs and ETNs, but there is a caveat. I have seen that instruments like VXX and XIV show only about one third the gains/losses of the index, so please do not expect 200% returns each year - it will more likely be a third to a quarter of that amount. Also, these ETFs do not mirror the index as well as most people think - in fact there are times when they will show a loss when the index would have gained, and vice versa. PART II: THE RISK OF OVERFITTING ... Whenever you cherry pick 20 strategies out of over 2,000,000, you really ought to be very careful about overfitting. Having every day of results and running a backtest against them almost guarantees a good result, but makes no promise about how those strategies might perform against data that is outside of the same period used in the search. The most obvious thing about the ^VIX during the period 2011-2016 is that it went down a lot during a time of almost unprecedented stock market gains. In order to be at all useful, trading systems must be tested against "out-of-sample" data and need to show decent performance against a range of market conditions, ideally containing short-term market dislocations and both recessionary and strong recovery periods. To that end, I took these "Top 20" filters and applied them against the ^VIX for the period 9/1/1999 through 9/1/2009 (10 years of new data, all out of sample). I did nothing to adjust the strategy parameters, just wanted to see how well or badly they would have performed. Here are the results: The equity curve: 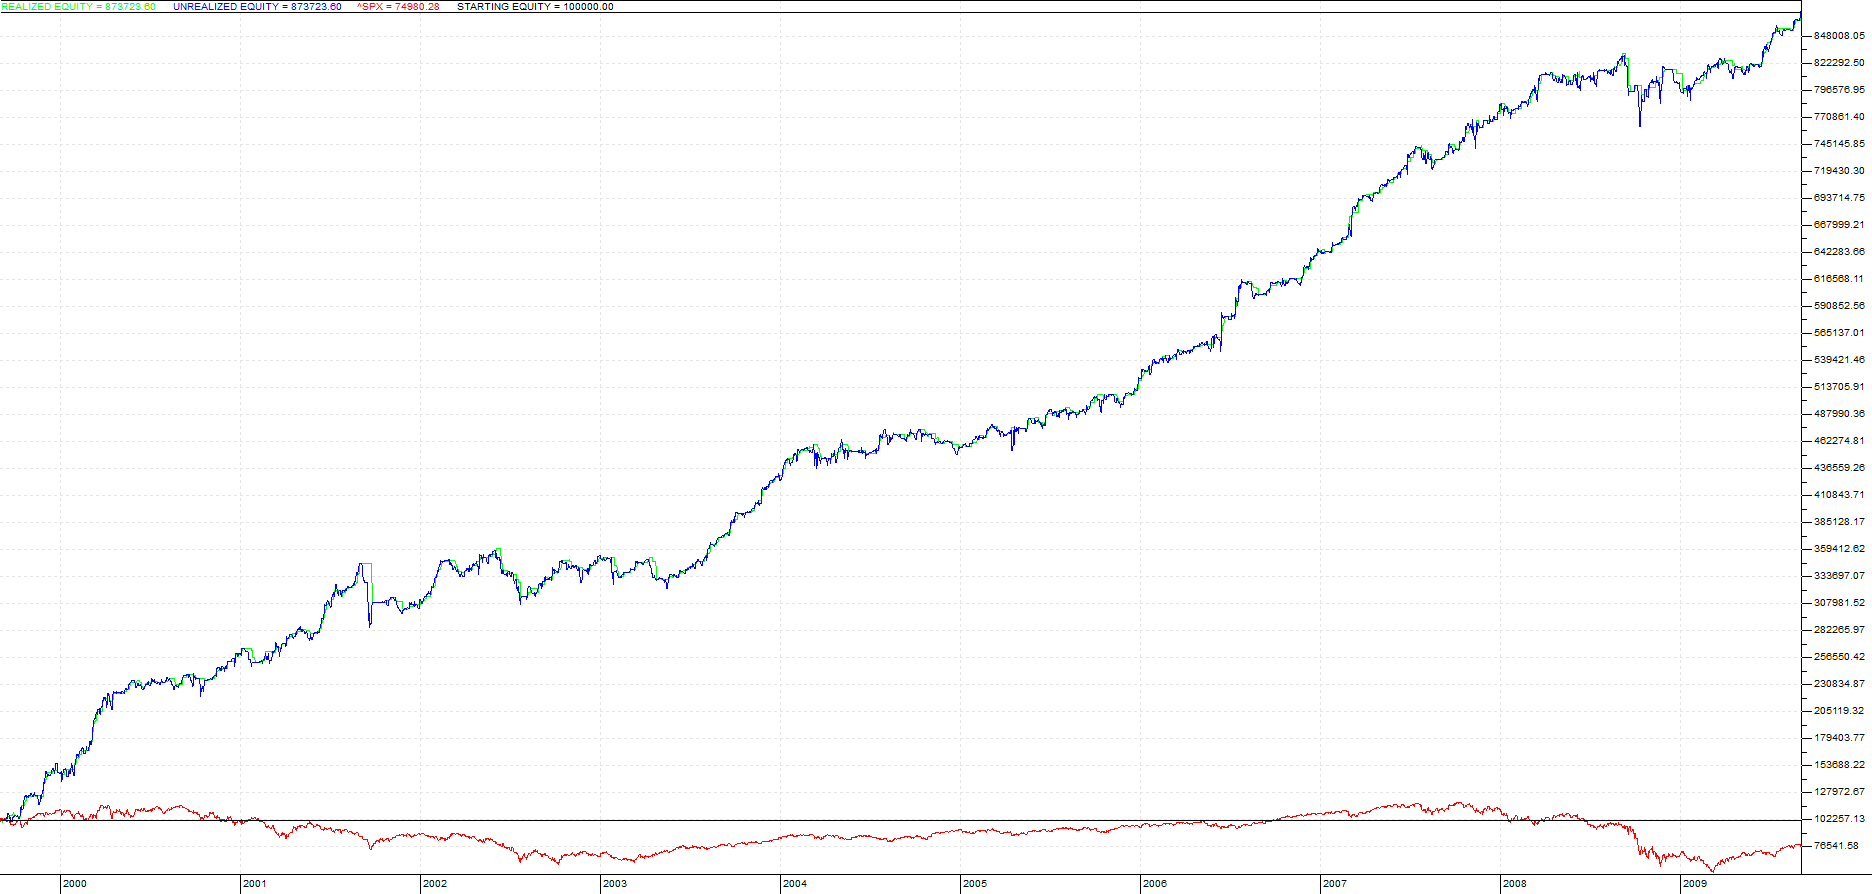
The Stats: 
I had honestly expected them to perform like crap, but it looks like they did exceptionally well against the out-of-sample data. PART III: THE FILTERS Here are the complete SS codes for each system, and to the extent that I can I have also included the corresponding SF code. Not all of the filters translate into SF code, and in some cases I am making approximations due to the limits of SF code structure and functions. VIX LONG SIGNAL #1: ENTRY: // Accumulation Swing Index: 2 (Primary)
EXIT: // Accumulation Swing Index: 2 (Primary)
Not readily translatable into SF code - the accumulation swing index here on SF does not specify how many days of accumulation are used, and there is no functional equivalent for Price channels. VIX LONG SIGNAL #2: ENTRY: // Aroon Crossover: 2 (Primary)
EXIT: // Aroon Crossover: 2 (Primary)
This can be coded in SF except for the maximum 10 day hold, which you will need to keep track of. VIX LONG SIGNAL #3: ENTRY: // Envelopes: 2 (Primary)
EXIT: // Envelopes: 2 (Primary)
This can be coded in SF except for the maximum 10 day hold, which you will need to keep track of. VIX LONG SIGNAL #4: ENTRY: // Momentum Divergence: 1 (Primary)
EXIT: // Momentum Divergence: 1 (Primary)
This can be coded in SF except for the maximum 10 day hold, which you will need to keep track of. VIX LONG SIGNAL #5: ENTRY: // Stochastics Crossover: 2 (Primary)
EXIT: // Stochastics Crossover: 2 (Primary)
This can be coded in SF except for the maximum 10 day hold, which you will need to keep track of. VIX LONG SIGNAL #6: ENTRY: // Bollinger Bands: 1 (Primary)
EXIT: // Bollinger Bands: 1 (Primary)
This can be coded in SF except for the maximum 10 day hold, which you will need to keep track of. VIX LONG SIGNAL #7: ENTRY: // TEMA: 2 (Primary)
EXIT: // TEMA: 2 (Primary)
The triple exponential moving average used here (TEMA) does not have an exact SF counterpart - the closest thing is a triple exponential function called T3 but I cannot verify if it is the same since it requires two parameters versus only one for the SS version. Therefore I would not use it since it would likely give different signals. VIX LONG SIGNAL #8: ENTRY: // Directional Movement: 2 (Primary)
EXIT: // Directional Movement: 2 (Primary)
This can be coded in SF except for the maximum 10 day hold, which you will need to keep track of. VIX LONG SIGNAL #9: ENTRY: // Qstick Crossover: 2 (Primary)
EXIT: // Qstick Crossover: 2 (Primary)
Same issue as in VIX LONG #1, the period for SF's ASI function is unknown, so I would not code this since it is likely to give different signals from those generated by SS. VIX LONG SIGNAL #10: ENTRY: // Commodity Channel Index (Classic): 2 (Primary)
EXIT: // Commodity Channel Index (Classic): 2 (Primary)
Stratasearch can use sector-based and exchange-based functions (SF cannot) so in this filter the Price Oscillator should translate over to just ^VIX since there is no sector or exchange for it, but I have not confirmed this yet. Also, the moving average used in SS is exponential and in SS it is simple. Caveat. VIX SHORT SIGNAL #1: ENTRY: // Price Rate-of-Change Divergence: 2 (Primary)
EXIT: // Price Rate-of-Change Divergence: 2 (Primary)
SF does not have a DMI() indicator so I cannot code this one. VIX SHORT SIGNAL #2: ENTRY: // Projection Oscillator Divergence: 2 (Primary)
EXIT: // Projection Oscillator Divergence: 2 (Primary)
Here we encounter the SS diverge() function, which I had requested SF build a while back (they did). However, it cannot be used within set{} statements or when using custom user functions. Luckily it can be coded using a lot more set{} statements. VIX SHORT SIGNAL #3: ENTRY: // Price Rate-of-Change Divergence: 2 (Primary)
EXIT: // Price Rate-of-Change Divergence: 2 (Primary)
This can be coded in SF as follows, but not the 10 day hold. VIX SHORT SIGNAL #4: ENTRY: // Moving Average Crossover: 1 (Primary)
EXIT: // Moving Average Crossover: 1 (Primary)
This can be coded in SF as follows, but not the 10 day hold. VIX SHORT SIGNAL #5: ENTRY: // TRIX: 1 (Primary)
EXIT: // TRIX: 1 (Primary)
This can be coded in SF as follows, but not the 10 day hold. VIX SHORT SIGNAL #6: ENTRY: // Price Channels: 1 (Primary)
EXIT: // Price Channels: 1 (Primary)
This cannot be coded in SF due to the lack of a price channel function. VIX SHORT SIGNAL #7: ENTRY: // Price Oscillator: 1 (Primary)
EXIT: // Price Oscillator: 1 (Primary)
This can be coded in SF but the way in which Stratasearch treats "sectors" and "exchanges" may yield different signals. Caveat. VIX SHORT SIGNAL #8: ENTRY: // Price Channels: 1 (Primary)
EXIT: // Price Channels: 1 (Primary)
This cannot be coded in SF since there is no equivalent price channel function VIX SHORT SIGNAL #9: ENTRY: // Linear Regression Indicator: 1 (Primary)
EXIT: // Linear Regression Indicator: 1 (Primary)
This can be coded in SF but the way in which Stratasearch treats "sectors" and "exchanges" may yield different signals. Caveat. VIX SHORT SIGNAL #10: ENTRY: // TEMA: 1 (Primary)
EXIT: // TEMA: 1 (Primary)
This cannot be directly coded in SF because of a lack of the TEMA() function. PART IV: SHARING CURRENT (AND FUTURE) SIGNALS As of 9/2/2016 there is one new Long signal trigger (from VIX LONG SIGNAL #1) and one Short position being held since the open on 8/29 from VIX SHORT SIGNAL #1 (shorting the ^VIX at 14.09, it is currently at 11.98). The new long position should be entered at the open on Tuesday. There are no other open positions or signals right now. I will post any new signal or changes in positions taken as the signals occur. At your own discretion you may enter positions using VXX/TVIX/UVXY (for Longs) or XIV/SVXY (for shorts) but remember that the signals are based ON THE INDEX and not on the ETFs, and typically the ETFs do not perfectly mirror the index in magnitude or even direction at times. I'm sharing these with the SF community to provide folks here with a new set of strategies to add to their trading armory. Hopefully this will help both new and more experienced traders to be successful in what is clearly a challenging effort - making money. |
| shillllihs 6,102 posts msg #130880 - Ignore shillllihs modified |
9/5/2016 7:26:14 PM So I'm trying to understand this since I'm in a Labor Day bbq food coma, 1 should have 2 positions open, 1 in Tvix and 1 in Xiv. How much of each, equal parts? Or should the short position be closed out Tuesday or is that position closed? |
| Kevin_in_GA 4,599 posts msg #130882 - Ignore Kevin_in_GA modified |
9/5/2016 7:42:26 PM The system trades a "unit" which is always the same size or dollar value. Also, you are using a 2x leveraged ETF for long but only an inverse for short. You might be better using VXX and XIV since the backtesting assumes equal leverage long and short. Short position stays open, already at a profit. A new long position is opened tomorrow at the open. Likely that the short position will be closed soon (at a profit), while the long position stays open. That is how multiple long and short positions can be held simultaneously - they open and close at different times, but mostly both close for a profit (win rates are close to 90+% for all 20 systems listed). |
| shillllihs 6,102 posts msg #130885 - Ignore shillllihs modified |
9/5/2016 7:59:24 PM I considerd using units to trade the same instrument long and short years ago, I knew it was a good idea but had trouble justifying being long and short at the same time. Since some indicators would point long, while others a few days later would point short simultaneously, it made sense. So how would you handle the higher leverage of Tvix to Xiv? |
| compound_gains 225 posts msg #130886 - Ignore compound_gains |
9/5/2016 8:15:19 PM Nice work Kevin, as always. If someone was going to trade this I'd be inclined to look at VIX options, perhaps three months out, deep-in-the-money, calls or puts depending on whether you're going long or short. IMO, and I think it's largely substantiated, the VIX-related ETNs (VXX, VXZ, TVIX, XXV, XIV) tend to be a curse on investors, especially if you're looking to go long, and don't particularly reflect VIX movement for several different reasons. |
| Kevin_in_GA 4,599 posts msg #130887 - Ignore Kevin_in_GA |
9/5/2016 8:18:08 PM So how would you handle the higher leverage of Tvix to Xiv? The specific instrument you choose is up to you - higher returns for TVIX but also a potentially larger drawdown. The simple solutions are: 1. Take a half position in TVIX versus a full position in VXX (lower risk, lower potential return). 1. Ignore the difference since each long trade is independent of any simultaneous short trade (higher risk, higher total return). 3. Take a double position in XIV if you plan to trade TVIX (highest risk, highest return). My point was only that in the backtest the leverage was the same - trading TVIX instead of VXX should work as well and provide a higher return. |
| StefanM 25 posts msg #130891 - Ignore StefanM |
9/6/2016 3:27:59 AM @Kevin, did you create a Mulri-System in StrataSearch and then run a Walk-Forward Analysis? I also use StrataSearch, but it is not so easy for me to understand, German is my first language and my trading style has been more discretionary, so all this is quite new to me .. |
| Kevin_in_GA 4,599 posts msg #130892 - Ignore Kevin_in_GA |
9/6/2016 7:38:33 AM No - it is very challenging to run a WFA on a multi-system since it typically uses 4-12 different settings per system which each need to be periodically re-evaluated (e.g., once per month) - raised to the 20th power since it must be done on all 20 systems in the multi-system each time. The goal of a WFA is to see how a system does against new (out-of-sample) data, which I did using the period 1999-2009. |
| StefanM 25 posts msg #130893 - Ignore StefanM |
9/6/2016 8:57:25 AM Sorry but I only understand partially what you mean. What I want to understand is how you get the 2 equity curves for 20 different setups. Obviously you combine them. You run a brute force, find the 20 systems, and combine them in a multi strategy setup? This brings up your first equity curve. And how do you bring up the second curve with the out-of-sample data? I did not understand if the curve is the result of a WF analyse, of it you used another tool of StrataSearch. I do not ask so much about details of your strategy but more about a "how-to" in StrataSearch .. |
| Kevin_in_GA 4,599 posts msg #130895 - Ignore Kevin_in_GA modified |
9/6/2016 9:50:04 AM You combine the 20 systems developed against the data from 2011-2016 into a multi-system. Then you change the trade settings to run over a new period (I chose 1999-2009) and you run the multi-system against that period. That is how the second curve and stats are developed. I do not ask so much about details of your strategy but more about a "how-to" in StrataSearch That is what I would like to avoid here - I would rather have this thread be focused on the trading system itself rather than how to do things in Stratasearch. I would suggest reviewing the documentation and looking through the forums over at Stratasearch.com - you will find the answers to most of your questions. Thanks, Kevin |
| StockFetcher Forums · Filter Exchange · A NEW ^VIX TRADING SYSTEM | << 1 2 3 4 5 ... 49 >>Post Follow-up |